To Notes

IT 223 -- Jan 6, 2027

Review Exercises

  1. What is the proper filename for a Project 1 submission?
  2. Matching:
    a. Fisher 1. First Stated the Central Limit Theorem
    b. Cotes 2. Tried to find the "ideal man" that nature was trying to produce
    c. Tukey 3. Was the first demographer to use statistics.
    d. de Moivre 4. Coined the term "exploratory data analysis."
    e. Pascal 5. Father of modern statistics.
    f. Gauss 6. First described the least squares method.
    g. Graunt 7. First studied the theory of errors applied to astronomy.
    h. Galton 8. First applied the theory of probability to gambling.
    i. Quetelet 9. Introduced the concept of correlation.
  3. What is a lurking variable?
  4. Why is it important for a clinical trial to be randomized and double blind?
  5. What is the difference between a controlled experiment and an observational study?
  6. Give examples of categorical, ordinal, and continuous variables.
  7. Which R function is used to create a vector.
  8. What is the R assignment operator?
  9. True or False. In the R language, vector indices are zero-based.
  10. Use R to compute Q0, Q1, Q2, Q3, and Q4 for these Celsius temperatures:
    38 54 52 49 65 58 103 12 70
    
  11. Use R to create the stemplot, histogram, and boxplot of the Celsius temperatures in the previous exercise.

Quartiles

Boxplots

Histograms

Practice Problems

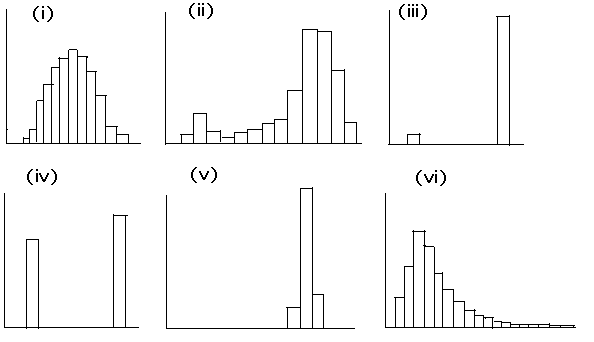
  1. Match the descriptions with the histograms below:
    1. The gender of all persons in a college class (male = 0, female = 1).
    2. The handedness of all persons in a college class (left handed = 0, right handed = 1).
    3. The heights of all married persons counted separately.
    4. The heights of all persons in families where both parents are 28 years old or less.
    5. The heights of all automobiles.
    6. The incomes of all persons in the U.S.
Using R

Project 2

More Practice Problems

  1. Draw the histogram in each for tables (1), (2), and (3). [a,b) denotes an interval that is closed on the left (includes a) and open on the right (does not include b).

    Caution: what does it mean for histograms (b) and (c) to have bins of different widths?
    Answer: If the bars of a histogram have unequal widths, the area of a bar represents the frequency (the number of observations in the interval under the bar).  The height of each bar is then frequency per horizontal unit. For unequal bin widths, the height of a bar is called the density.

       Table (a)     Table (b) Table (c)
    Bin Count
    [0,1) 1
    [1,2) 3
    [2,3) 5
    [3,4] 1
    Bin Count
    [0,1) 3
    [1,2) 5
    [2,4] 2
    Bin Count
    [0,1) 2
    [1,2) 4
    [2,2.5) 3
    [2.5,3] 1
  2. Compute the median for each histogram in the preceding problem by using interpolation in the bar that contains the median.
    Ans: Problems 1a, 1b, and 1c.
  3. Compute the interquartile range of the histogram of Problem 12c by using interpolation in the bars that contain Q1 (25th percentile) and Q3 (75th percentile).
    Ans: Problem 7.
  4. In Histogram (3), use interpolation to estimate the percentage of observations in the interval [0.5, 2.5).
    Ans: The area of the histogram rectangle over the interval [0.5, 1.0) has half of the area of the histogram rectangle over the interval [0,1), which is 30%. Also, the histogram area of the rectangle over the interval [2, 3.0) has half of the area of the area of the histogram rectangle over the area of the histogram area over the interval [2, 4), which is 10%. Therefore:
  5. Draw the histogram without bar lines of
    1. the incomes of all persons in the U. S.
      Ans: A skewed histogram with a peak at about 35 or 40 thousand, but with a long right tail that extends all the way past 1 billion.
    2. the GPAs of all students at DePaul.
      Ans: A bell-shaped histogram with peak around 3.0. There may be a secondary peak around 2.0, representing those students that have just come off of academic probation. The height of the histogram can only be nonzero in the range from 0 to 4.
    3. the number of years of schooling of all persons in the U. S.
      Ans: A bell-shaped peak around 12 years (most people finish highschool, less people attend college)