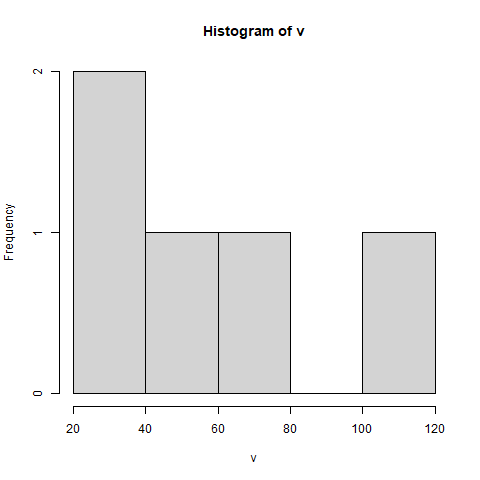
> hist(v)
download R for Windows
download R for Mac
> help("quantile")
> v <- c(34, 29, 71, 49, 118)<- is the R assignment operator.
> v
[1] 34 29 71 49 118
> print(v)
[1] 34 29 71 49 118
> mean(v)
[1] 60.2
> quartile(v, 0.25)
25%
 34
> quartile(v, 0.75)
75%
 71
> quartile(v, 0.75)
  25%  75%
   34   71
> hist(v)
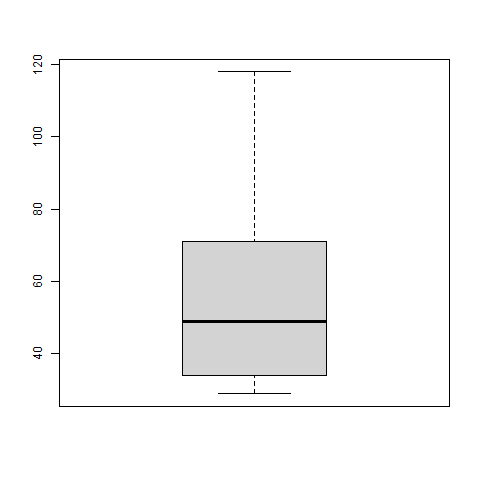
> boxplot(v)
> # The lines that start with # are comment lines.
> # The /it223 directory should already be created.
>
> # Set working directory to /it223 on the C drive.
> setwd("C:/it223")
>
> # Send graphical output to PNG image file:
> png("hist.png")
>
> # Create histogram, which goes to image file:
> hist(v)
>
> # End redirection -- resume sending graphical
> # output to R Console.
> dev.off( )
These additional functions are available for sending
graphical output to other image file types:bmp jpeg tiff