To Notes

IT 223 -- Apr 22, 2024

Review Exercises

  1. What does it mean for a univariate dataset to be standard normal?
    Answer: it means that the dataset is normally distributed with mean=0 and sd=1.
  2. Verify the following for standard normal observations. Use the standard normal table.
    (a) 68% are between -1 and 1;
    Answer: area[-1, 1] = area(-∞, 1] - area(-∞, -1] =
    0.8413 - 0.1587 = 0.6826 = 68%.
    (b) 95% are between -2 and 2.
    Answer: area[2, -2] = area(-∞, 2] - area(-∞, -2] =
    0.9772 - 0.0228 = 0.9544 = 95%
  3. IQ scores are normally distributed with mean = 100 and SD=15. How many persons out of 100 have an IQ score greater than 120?
    Answer: First compute the z-score z = (120 - 100) / 15 = 20 / 15 = 1.33.
    Then area[1.33, ∞) = 1 - area(-∞, 1.33] = 1 - 0.9082 = 0.0918 = 9%.
  4. IQ scores are normally distributed with mean = 100 and SD = 15. How many persons out of one billion have an IQ score greater than 175?
    Answer: z = (x - mu) / sigma = (175 - 100) / 15 = 5. Use the Extreme Values of the Normal Distribution table to see that the proportion of scores greater than 5 is 2.867 × 10⁻⁷. Multiply this proportion by 1 billion = 109 to see how many persons out of one billion have an IQ score greater than 175:
    2.867 × 10-7 * 109 = 286.7 ≈ 287.
  5. Use R to verify your answers in Exercises 2 and 3. Answer:
     > # 1a.
    > pnorm(1) - pnorm(-1)
    [1] 0.6826895
    > # 1b.
    > pnorm(2) - pnorm(-2)
    [1] 0.9544997
    > # 2.
    > 1 - pnorm(120, mean=100, sd=15)
    [1] 0.09121122
    > # 3
    > (1 - pnorm(175, mean=100, sd=15)) * 10**9
    [1] 286.6516
    
  6. Use R to compute the z-scores of this list:
         54   89   23   56   80   45   76
    x <- c(54, 89, 23, 56, 80, 45, 76)
    z <- (x - mean(x)) / sd(x)
    [1] -0.2809356 1.2486026 -1.6356694 -0.1935334 
    [4]  0.8552928 -0.6742454 0.6804884
    
    
  7. Plot the histogram of the z-scores in Exercise 5. Answer:
    > hist(z)
    

Normal Plots

Practice Problems

  1. Compute normal scores for a dataset of size 9.
    Answer: Choose the z-scores that divide the standard normal curve into 9 + 1 = 10 equal areas:
    -1.28  -0.84  -0.52  -0.25  0.00  0.25  0.52  0.84  1.28
  2. Construct the normal plots by hand of this dataset:
     
           81   95   97   101   112   125   129   167   220
  3. Create the normal plot for this dataset with R. Answer:
    > x <- c(81, 95, 97, 101, 112, 125, 129, 167, 220)
    > qqnorm(x)
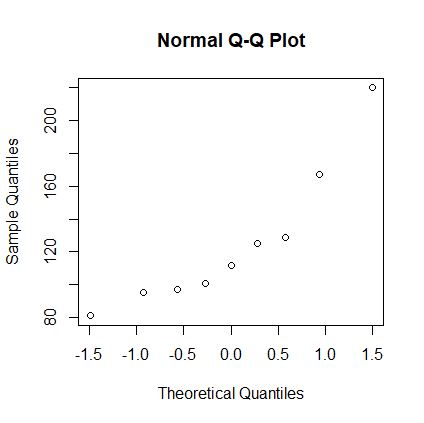
    

    Normal Plot 1

R Practice Problems

  1. Create 50 values of a normal random variable x with μ = 15, σ = 3.8.
    1. Create a histogram of x.
    2. Create a normal plot of x.
    Answer:
    > x <- rnorm(50, mean=15, sd=3.8)
    > hist(x)
    > qqnorm(x)
    
  2. Create 50 values of a uniform random variable x in the range [10, 50]:
    > x <- runif(50, min=10, max=50)
    
    1. Create a histogram of x.
    2. Create a normal plot of x.
    Answer:
    > x <- runif(50, min=10, max=50)
    > hist(x)
    > qqnorm(x)
    

Project 2

The Standard Error of the Average