To Lecture Notes
CSC 423 -- 7/24/17
Review Exercises
- What does a 99% confidence interval for the population mean tell you? (Also
see Problems 2 and 6.) Find a
99% confidence interval for these IQ scores:
Ans:
No matter how many times you construct a confidence interval for the population
mean by choosing a random sample, the population mean μ is fixed. It is the
confidence interval that will change from sample to sample, and if the
population is normally distributed, the 99% confidence interval will contain the
true population mean μ 99% of the time.
To construct the 99% confidence interval for the true measurement μ
you need the sample mean x and the standard error for the mean SEmean
(computed from the sample standard deviation and the sample size). Because n <
30, we use the t-distribution instead of the normal distribution for
constructing the confidence interval. (My advice is to always use the
t-distribution, even when n ≥ 30.)
x = 105.75 sx = 3.096 SEmean = sx / √n =
3.096 / √4 = 1.548
Look up a 99% confidence interval (alpha = 0.005) in the t-table in these Statistical Tables using n - 1 = 3 degrees of freedom: (-3.182, 3.182). Then
-5.841 ≤ t ≤ 5.841
-5.841 ≤ (x - μ) / SEmean ≤ 5.841
-5.841 ≤ (105.75 - μ) / 1.548 ≤ 5.841
-114.79 ≤ -μ ≤ -96.71
96.71 ≤ μ ≤ 114.79,
so the 99% confidence interval for μ is (96.71, 114.79).
You can also obtain the t-table value from R like this:
val = qt(0.0995, 3)
and from SAS in a data step like this:
val = quantile("t", 0.0995, 3);
- Use SAS and R to obtain a 99% confidence interval for the population mean of
the dataset in Exercise 1. Ans:
* SAS script;
  The @@ at the end of the following
  input line holds the data line for
  additional observations.  Without
  the @@, only the first observation
  will be read.;

data iq_scores;
   input score @@;
datalines;
103 110 104 106
;
proc means clm alpha=0.01;

SAS Output:
 Lower 99%     Upper 99%
CL for Mean  CL for Mean
------------------------
 96.7091604  114.7908396
------------------------

# R script
x = c(103, 110, 104, 106)
t.test(x, NULL, conf.level=0.99)

R output:
 One Sample t-test

data: x
t = 68.321, df = 3, p-value = 6.91e-06
alternative hypothesis: true mean is not equal to 0
99 percent confidence interval:
   96.70916 114.79084
sample estimates:
mean of x
   105.75
- Which statistics can the SAS proc means compute? Which R functions compute these
same statistics?
Ans: Recall that the SAS proc means statement without any options computes the simple descriptive statistics
sample size, mean, standard deviation, minimum, and maximum. However,
proc means can also compute many other statistics if
requested as options. Here are the proc means options:
SAS proc means
option | Meaning | R Function |
| n | Sample size | length |
| mean | Sample mean | mean |
| std | Sample standard deviation | sd |
| stderr | Standard error of the mean | |
| min | Minimum value of the sample | min |
| max | Maximum value of the sample | max |
| skewness | Measures the skewness of the sample;
positive value means skewed to the right;
negative value means skewed to the left |
skewness,
moments
package |
| kurtosis | Measures the thickness or thiness of the
tails of the sample; positive value means
thick tails relative to a normal distribution;
negative value means thin tails relative
to a normal distribution |
kurtosis,
moments
package |
| lclm | Lower confidence limit for the mean | t.test |
| uclm | Upper confidence limit for the mean | t.test |
| clm | Both lclm and uclm | t.test |
p1 p5 p10 p25 p50
p75 p90 p95 p99 | These precentiles | quantile |
| q1 | 25th percentile | quantile |
| q3 | 75th percentile | quantile |
| qrange | Interquartile range (q3 - q1) | IQR |
| t | Test statistic for one-sample
t-test with H0: μ=0 | t.test |
| prt | Two sided p-value for one-sample
t-test with H0: μ=0 | t.test |
To obtain confidence intervals (clm, lclm, and/or uclm) other than 95%, specify
value of alpha.
- What are the assumptions for a one sample z-test? for the one-sample t-test?
- What the definition of the p-value for a statistical test.
- To test whether eating fish makes increases intelligence, a researcher selects a random sample of
four persons and
puts them on a fish-rich diet for one year. At the end of the year, she
gives each subject an intellegence test. Here are the results:
- Test the null hypotheses that the eating fish does not make a difference using a t-test. Ans:
Step 1: State the null and alternative hypotheses: H0: μ=100, H1: μ≠100
Step 2: Compute the test statistic: t = (x - μ) / SEmean = (105.75 - 100) / (3.096 / √4) = 3.715
Step 3: Find a 95% confidence interval using the t-table with n - 1 = 4 - 1 = 3 degrees of freedom: I = [-3.182, 3.182].
Step 4: 3.715 ∉ [-3.182, 3.182], so reject H0.
Step 5: Use SAS or R to find the p=value: 0.034. Since p < 0.05, this confirms that H0 should be rejected.
- Suggest a way to improve the design of the experiment?
Ans: (1) choose a larger sample size, (2) use a treatment group that eats fish and a control group that does not, then use an independent-sample t-test.
- Explain the difference between the paired-sample t-test and the independent two-sample t-test.
Ans: With the paired-sample t-test there is a natural pairing between the observations in Group A with the observations
in Group B. Thid pairing may reduce the variability and increase the chances of rejecting the null hypothesis or of obtaining a low p-value.
- For each of these scenerios, which t-test would you use? Ans:
- Independent
- Paired, pair each subject in the study with his or her twin;
- You could assign whole houses to paint brands (independent) or randomly choose exterior walls of each house to paint (paired)
- Paired, pair up the men and the women and let both subjects in the pair drive the same car
- Paired, let each tester in the study evaluate both websites
- Pair up the paper measurements by measurer.
- To see how R can get confused when trying to read from a UTF-8 data file:
Notice the ï.. in the header of the data frame. R is confused because of the
UTF-8 byte order marks at the beginning of the data file.
There are two ways to correct this problem:
- Open the data file with Notepad and select Save As. Before saving the file,
change the encoding at the bottom to ANSI.
- Create a new datafile in the c:/datasets folder. Then copy and paste the
contents of the file from the browser into the new datafile.
Some Arguments for R Plots
| col | Sets the color of the plotting symbols. |
| cex | Sets the relative size of the plotting symbols. |
| main | Sets the title for a plot. |
| pch | Sets the plotting character for a plot.
Legal values are keyboard
characters
in quotes or integers from 1 to 15, not in quotes. |
| xlab | Sets the label for the x-axis. |
| xlim | Sets the minimum and maximum values for the x-axis. |
| ylab | Sets the label for the y-axis. |
| ylim | Sets the minimum and maximum values for the y-axis. |
For example:
x = rnorm(30)
y = rnorm(30)
plot(x, y,
   main="Plot of 30 Bivariate Normal Random Values",
   xlab="Independent Variable", ylab="Dependent Variable",
   pch="*", cex=2, xlim=c(-5,5), ylim=c(-5,5), col="red")
To see what the plotting symbols from 1 to 20 look like, use this R script
x = 1:20
plot(x, x, pch=x)
Examples of Correlation
- The news is filled with examples of correlations and associations:
Drinking a glass of red wine per day may decrease your chances of
a heart attack.
Taking one aspirin per day may decrease your chances of stroke or
of a heart attack.
Eating lots of certain kinds of fish may improve your health and
make you smarter.
Driving slower reduces your chances of getting killed in a traffic
accident.
Taller people tend to weigh more.
Pregnant women that smoke tend to have low birthweight babies.
Animals with large brains tend to be more intelligent.
The more you study for an exam, the higher the score you are likely
to receive.
Covariance and Correlation
- Details about covariance and correlation
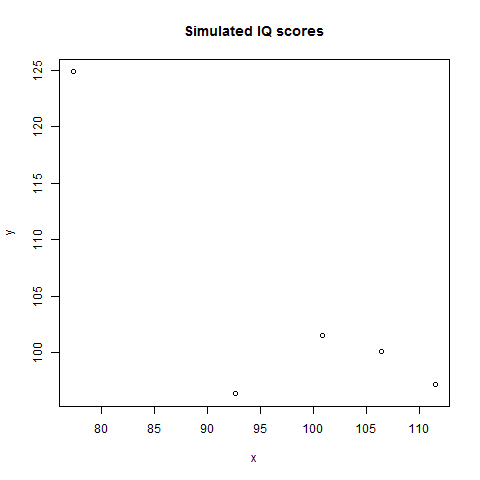
- R Simulation: generate two sets of simulated random IQ scores (mu = 100, sigma = 15) with five observations each:
{x1, x2, x3, x4, x5},
{y1, y2, y3, y4, y5}
Compute the correlation and plot the x- and y-values. You can use
this R script.
When I try it I obtain this graph with this output:
[1] -0.8234398
This shows that with a small number of observations, it is easy to obtain a high correlation (in this case negative) just by chance.
Here is a SAS script that does the same thing, with the generated
graph and output.
Of course the points generated by SAS are different than the points generated by R because they are random.
Look at the BearsCorr Example.
See the TireWear Example.
Simple Linear Regression
To obtain the regression through the origin equation y = ax using SAS:
proc reg;
   model disp = force;
Both SAS and R obtain this simple linear regression equation for the
SpringReg Example:
force = 50.5 * disp - 0.4
An alternative to the simple linear regression is regression through the origin, where the regression line is forced to pass through the origin (0, 0).
To obtain the regression through the origin equation y = ax using SAS:
proc reg;
   model disp = force / noint;
To obtain the regression through the origin equation y = ax using R:
noint_model = lm(force ~ noint + 0)
Both SAS and R obtain this regression through the origin equation for the
SpringReg Example:
force = 50.06667 * disp (no intercept)
BearsReg Example
Residual Analysis
Project 2
Least Squares Estimators
- Linear Regression: Three Regression Models
- Derive the LSE for the Horizontal Line Regression Model
yi = μ + εi. Ans.:
- Derive the LSE for the Regression through the Origin Model
yi = a xi + εi. Ans:
yi^ = a^ xi,
a^ =
(
Σi=1n xi yi
) / (
Σi=1n xi2
)
- Derivations of the LSE for Four Regression
Models (See this document for technical details)
- In class, we only discuss the derivations of the Horizontal Line Regression and the Regression through the Origin
models.
- Here is the simple linear regression equation expressed in terms of the sample means, standard deviations,
and sample correlation:
y - y = (r sy / sx) (x -
x)
- Practice Problems:
- Use SAS or R to compute x, y, sx, sy, and r for
the following bivariate dataset:
Then use these statistics to compute the simple straight line regression equation for this dataset.
Ans: Here are the R and SAS scripts. The computed statistics are
x = 2.5 y = 2.5 sx = 1.290994 sy = 1.290994 rxy = 0.8.
Then sub these values into the simple linear regression equation:
y - y = (rxy sy / sx) (x - x)
y - 2.5 = (0.8 * 1.290994 / 1.290994)(x - 2.5)
y - 2.5 = 0.8 * x - 0.8 * 2.5
y = 0.8x + 0.5
- At the University of Southern North Dakota law school, the average LSAT score of incoming students 162 with
a standard deviation of 6. The average first year score is 68 with a standard deviation of 10. The
correlation of the LSAT scores with the first year scores is 0.6. Compute the regression equation for
predicting first year score from LSAT score. What is the predicted first year score for someone with
LSAT score 168? Ans:
y - y = (rxy sy / sx) (x - x)
y - 68 = (0.6 * 10 / 6)(x - 162)
y - 68 = x - 162
y = x - 94
Substitute x = 168 into the regression equation: y^ = 168 - 94 = 74.