Assignment 4
Due: Sunday, May 31
In this Assignment you will explore and experiment with clustering in some of
its applications in Web usage mining, customer segmentation, and recommender
systems. Note: An example of using WEKA for clustering (using an older
version of WEKA) can be found in K-Means
Clustering in WEKA.
-
Consider the following document-term matrix, where each entry
represents the raw frequency of a term Ti in document
Dj. We would like to apply clustering to automatically
group these documents into 3 classes (clusters). Note: You must not
use WEKA or other clustering tools for this problem. However, you are
encouraged to use a spreadsheet program such as Microsoft Excel to
facilitate computation in intermediate steps.
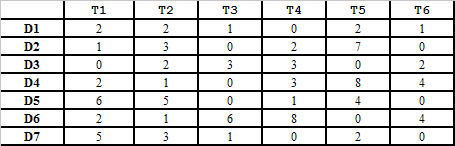
Download table as a Microsoft Excel Worksheet
Suppose we initially assign D2 to Class1,
D4 and D6 to Class2, and D5 and D7 to Class3.
Using the K-means clustering method discussed in class, compute the final contents
of the 3 classes. Use the Cosine similarity of two vectors as your similarity measure.
Show the details of your computation, including intermediate steps in each iteration of the
algorithm.
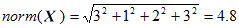
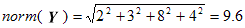
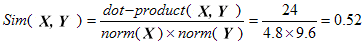
Note: Recall that the Cosine similarity of two vectors is their dot product divided
by the product of their norms. For example, Consider the two vectors X and Y:
  X = <3, 0, 1, 2, 0, 3>
  Y = <2, 0, 0, 3, 8, 4>
The dot product is given by sum of the coordinate-wise multiples:
  dot-product(X, Y) = 3*2 + 0*0 + 1*0 + 2*3 + 0*8 + 3*4
                      = 6 + 0 + 0 + 6 + 0 + 12
                      = 24.
The norm of each vector is the square-root of the sum of the squares of its dimension
values. So, the norms of X and Y are:
and the Cosine similarity of X and Y is given by:
- An online shopping site has the following primary pages or sections: Home, Products,
Search, Prod_A, Prod_B, Prod_C, Cart, Purchase. A user may browse from "Home" to
"Products" and then to one of the individual products. The user may also search for a
specific product by using the "Search" function. A visit to "Cart" implies that the user
has placed an item in the shopping cart, and "Purchase" indicates that the user has
completed the purchase of items in the shopping cart. The site has collected
some hypothetical
session data for 100 sessions. This data is available in
CSV and
format.
Use WEKA's K-means clustering algorithm to cluster these user sessions into segments. Try
different clustering runs with various numbers of clusters (e.g., between 4 and 8), and
select the result set(s) that seem to best answer as many of the following questions as
possible.
- If a new user is observed to access the following pages: Home => Search
=> Prod_B, according to your clusters, what other product should be
recommended to this user? Explain your answer based on your clustering results.
What if the new user has accessed the following sequence instead: Products =>
Prod_C?
- Can clustering help us identify casual browsers ("window shoppers"), focused browsers
(those who seem to know what products they are looking for), and searchers (those using the
search function to find items they want)? If so, Are any of these groups show a higher or
lower propensity to make a purchase?
- Do any of the segments show particular interest in one or more products, and if so, can
we identify any special characteristics about their navigational behavior or their purchase
propensity?
- If we know that, during the time of data collection, independent banner ads had been
placed on some popular sites pointing to products A and B, can we identify segments
corresponding to visitors that respond to the ads? (note that such user's are
likely to enter the site by going directly to product pages rather than navigate
from the Home page). If so, can we determine if either of
these promotional campaigns are having any success?
For this problem, you should submit your clustering result summary (including
the cluster centroids), the final
data set which shows the final assignment of these sessions to clusters, and your
answers to the above questions along with your justification based on the
clustering results.
Other Notes: You may also want to use WEKA's cluster visualization capabilities to identify
interesting distributions of various page visits among and within clusters.
Examples of using WEKA for clustering can be found in
K-Means
Clustering in WEKA.
-
For this problem you will use part of the actual customer
transaction data from a real bakery (bakery-binary.csv).
The data set contains 1000 customer transactions, each corresponding to
purchases by the customer during a visit to the store. The items
(attributes) are 50 assorted cakes, pastries, coffee products, etc. A 1 in a
transaction indicated the purchase of the corresponding item and a 0
indicates no purchase for that item. There is one additional attribute,
Weekend, indicating whether the transaction took place on a weekend (this
there are a total of 51 attributes). Your goal in this assignment is to use
clustering in order to identify different customer segments, and then
characterize those segments by analyzing the aggregate representations of
each cluster (the cluster centroids).
Your tasks in this problem are the following:
- Load
in the data into WEKA and select WEKA's K-means clustering algorithm (SimpleKmeans)
under the cluster tab. Cluster the customers and review the cluster
centroids. Try a few runs with different numbers of clusters (e.g., K values
between 4 and 8) and pick a result set that seems to provide clearly
distinguishable customer segments based on the centroid values of the
dominants items in those clusters. Include your final result set in your
submission along with a short summary of your other runs.
- Next, characterize the
customer segments by indentifying significant patterns represented in each
segment based on the cluster centroids. You can identify dominant items in
segments and make observations about sets of items that seem strongly
associated with each segment. Also compare different segments and discuss
what are the unique characteristics of each that distinguished that segment
from others. Finally, answer the following question: Is there a customer
segment that primarily makes purchases over the weekends, and if so, are
there specific items in which this group of customers is especially
interested? Include your analysis of customer segments in your submission.
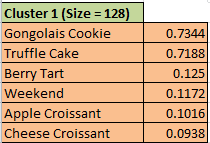
[Note: a good way to represent the clusters is to generate
"aggregate profiles" for each cluster. You can do this by exporting the
centroids given in WEKA output to a spreadsheet program such as Microsoft
Excel. Then, sort each centroid independently along with the item names in
the decreasing order of the cluster values for the items. This will make it
easier to focus on dominant items and compare clusters. You may also wish to
filter out the items with very low centroid values. See
an example of a typical profile for this
problem.]
- Based on your observations in part (b) can you identify
2-3 potential opportunities for the bakery to increase sales of one or more
of the products through cross-sell recommendations or other types of
customer incentives? Explain your answer.
-
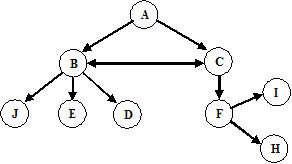
Consider the following table representing a user’s navigational activity as captured
in a server log file (assuming that data cleaning and user identification have already
been performed). Note: “-“ in the referrer field represents an external access and
is assumed to be different each time it occurs. The site graph for this hypothetical
site is also given below.
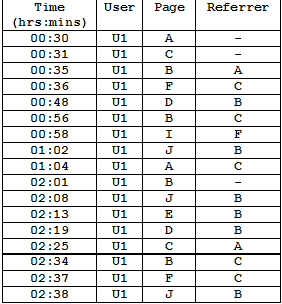
- Using sessionization heuristics, discussed in class, in each of the following cases
give the sessions constructed by the heuristic for the above user (give each session
as a list of pages accessed by the user during that session, e.g., S1 => A, C, B, ...
and S2 => I, J, ..., and so on).
- Sessions Using h1 heuristic with timeout threshold
 = 25 mins. = 25 mins.
- Sessions Using h2 heuristic with timeout threshold
 = 10 mins. = 10 mins.
- Sessions Using href heuristic (referrer-based heuristic)
- Suppose (hypothetically) that sessionization for a user U results in
a session given in the log file below:
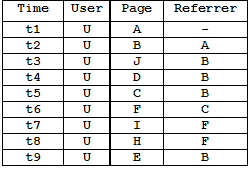
Perform path completion to fill in missing references due to client-side
caching. If there are multiple candidate completions, then use the
completion resulting in the fewest number of “back” references.
-
Consider again the
book
rating data from
20 users (U1-U20) that you used in Assignment 3. Recall that the ratings range from 1 = worst to 5 = best.
We have used K-means clustering algorithm to cluster these
users into 4 clusters. The results of clustering (cluster centroids) are
provided in the spreadsheet book-clusters.xlsx.
Recall that the two new users (NU1 and NU2) who have recently
visited the site and rated some of the books. The two new users' ratings are
given in the last two rows of the ratings spreadsheet.
In assignment 3 you used the K-nearest-neighbor (Knn) approach
to predict ratings for NU1 and NU2. In this problem you will compute predicted
ratings by comparing NU1 and NU2 to the cluster centroids.
- First compute the correlations between the new users (NU1 and NU2)
and the centroids of each cluster. Then using the most similar cluster to each
of these users, compute the predicted ratings for the books they have not yet
rated.
- Measure the Mean Absolute Error (MAE) on the predictions
using NU1 and
NU2 as test users. Recall that you can compute MAE by generating predictions for items
already rated by the test users (e.g., for NU1 these are all items except "The DaVinci Code"
and "Runny Babbit"). Then, for each of these items you can compute the
absolute value of the difference between the predicted and the actual ratings.
Finally, you can average these errors across all 12 compared items (for both NU1
and NU2) to obtain the
MAE. How does your MAE compare to the MAE you obtained using Knn
in Problem 4 (part b) in Assignment 3?
|
