
Assignment 4
(Supervised Learning)
Due Date: Thursday, November 10
Part 1. Naïve Bayes Classification for Text
In this problem your task is to implement your own version of a Naïve Bayesian classifier and use it for automatic text categorization. Specifically you will implement the Multinomial Naïve Bayes algorithm depicted in slides 74 and 75 of the lecture notes on Probabilistic Reasoning - Bayesian Learning. Note that the algorithm consists of two separate components: training and test. The training component learns from the training data by computing the prior and conditional class probabilities associated with different features (in this case terms in the vocabulary). The test component uses the learned model to classify a test instance that was not used for training (to simulate the situation where the learned model is used to classify a new document into one of the existing classes).
You will use this modified subset of the newsgroup dataset to train and test your classifiers. The original data set, often used for experiments in text applications of machine learning, contains 20,000 newsgroup posts as documents (see the description of the full dataset). The assignment data set contains a subset of 2500 documents from 5 newsgroup categories and a vocabulary of 9328 terms. The data has already been preprocessed to extract tokens, remove stop words and perform stemming. The data has already been split (80%, 20%) into training and test data both of which are provided in document x term matrix format, containing a row for each document and a column for each term in the vocabulary. Each document (a newsgroup post) belongs to one of five classes. The numerical class labels for instances in the training and the test data are provided in separate files. Please be sure to read the readme.txt file in the distribution for a more detailed description of the data.
The training component of your program, e.g., NB_Train(train_matrix, train_class_labels), learns from the training data by computing the priors for each class and the conditional (posterior) class probabilities associated with different features (in this case terms in the vocabulary). The test component, e.g., NB_classify(posteriors, priors, test_instance), uses the learned model (posterior and prior probabilities returned by the training function) to classify a test instance that was not used for training. Your program should work for any number of classes and not just for the number of classes in the provided data set. Note: to avoid floating point underflow, you should use the sum of log probabilities when computing the class labels using Bayes's rule (for uniformity, please use natural log when computing the log probabilities).
After training your classifer on the provided training data, your next task is to evaluate your classifier using the provided test data. For this task you should create an evaluation function to measure the accuracy of your trained classifier on the test set. This function will apply your learned model returned from the training component to predict a class label for each of the test instances in the test data. Then for each test instance, it compares the actual test class label to the predicted class label. Your evaluation function should return the Classification Accuracy (ratio of correct predictions to the number of test instances). It should also have the option to output the predicted class labels together with the sum of log probabilities for a portion of the test data (this is to illustrate that your classifier is working properly). Your program should also provide the capability to view the learned class probabilities for each class label and the posteriors for specified terms (again, this is to provide optional intermediate results demonstrating the proper functioning of your training function).
Deliverables include the following:
-
Your code [30 pts] (Similar guidelines as previous assignment apply to this assignment as well). Note that your main training and test components should be general (so that they can be applied to other similar data sets, including data sets with different number of classes) rather than hard coding specific characteristics of this particular data set. You need to implement your own training and testing components (including the computation of class probabilities), but for basic data processing and numeric computations, you may (but are not required to) use external libraries (for example, in Python, you may use libraries such as Numpy and Pandas). You may not, however, use built-in implementations of Naïve Bayesian classifiers from external machine learning libraries.
-
5 Minute Video [10 pts] (Your video should demonstrate how you computed probabilities in the training component and how you implemented the test component. It should also show you running your training and test programs and the results (including some sample intermediate results such as class probabilities for selected terms, predicted class labels for a sample of test instances, and the accuracy results).
-
Write up [10 pts]
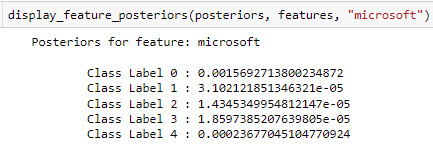
- After training your classifier, provide the prior probabilities
associated with each class label.
- Based on your trained model, provide the posteriors (conditional
class probabilities) for each of the following terms: "game", "god", "match",
"program", "sale". Note that this
is Pr(term | class) for each class. Here is
an example output using the term
"microsoft".
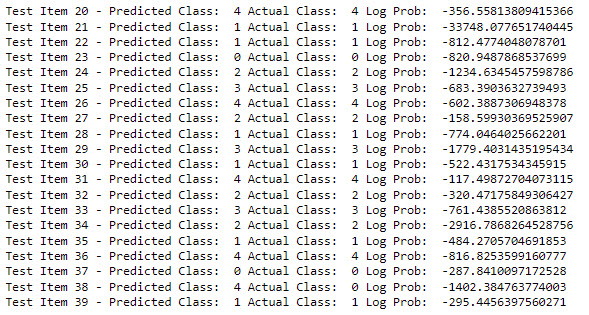
- Provide an output showing actual and
predicted class labels for the first 20 document instances
(instances 0-19) in the test data along with the log
probability values for each test instance. For example, see
this sample output for test instances
20-39.
- Using your evaluation function provide the overall classification accuracy across all test instances.
- After training your classifier, provide the prior probabilities
associated with each class label.
Part 2. Simple Recommender System using K-Nearest-Neighbor Collaborative Filtering
In this problem, you will implement your own version of a collaborative filtering recommender system that will use the K-Nearest-Neighbor (KNN) learning algorithm to predict users' ratings on items. Note that in contrast to the previous problem, KNN is not a model-based machine learning approach. In other words, there is no speparate training component to generate a model. Instead all the work is done at prediction time: when we want to generate a prediction for a test instance (in this case a user), at that point, we measure the similarity of that test instance, x, to every instance in the training data to identify the K most similar users to x. These are the K nearest neighbors. Your implementation should use the Pearson Correlation Coefficient as the similarity function (to compute similarities between the test instance and the training instances). Be sure to review the lecture notes on K-Nearest-Neighbor Learning and on Classification & Prediction: Basic Concepts (and the associated videos) before starting on this problem.
The basic tasks for this assignment can be described as follows:
-
Given: a user-item ratings matrix with rows corresponding to user records (ratings given by a user to various items), and columns corresponding to all items in the database. This is the training data.
-
Also given: a specific target user, u_t, and a target item, i_t. The item i_t is one of the existing items in our item database. The target user u_t may be a new user or an existing user and is represented as a vector of ratings over all items (a row in the ratings matrix).
-
The task is to compute the predicted rating of user u_t on item i_t (assuming that u_t has not previously rated i_t). Note also that if u_t is a test user who has an actual rating on item i_t, the predicted rating for i_t can still be generated and compared to the actual rating to measure prediction error rate.
-
As noted above, generating a predicted rating of user u_t on item i_t involves first identifying the K nearest neighbors of u_t among the users in the database. This is accomplished by computing the Pearson Correlation between u_t and all other users (rows in the ratings matrix) and ranking them in decreasing order of similarity [Note: when computing the correlation between two users, you must only consider the overalpping items, i.e., the items rated by both users). Once the nearest neighbors of u_t are identified, their ratings on item i_t (if they exist), are used to generate the prediction for user u_t. Specifically, the predicted rating of user u_t on item i_t will be the weighted average of the ratings of the K neighbors on item i_t (with the weight of the neighbor's being the similarity of that neighbor to u_t). This prediction algorithm is further described in this example. If there are no neighbors for user u_t with rating for the target item, then the returned prediction should be the mean rating on the item across all training users. Note that K (the number of neighbors) is a parameter that can be varied to determine the optimal number of neighbors in different data sets.
-
In addition to being able to generate a predicted rating for a given user u_t and and item i_t, your program should be able to generate a list of recommendations for a given user u_t. Given a user u_t and the number of desired recommendations N, your program should be able to generate the top N recommended items for u_t. To do this, your program will identify all items in the database not previously rated by u_t, and for each such item, the program will generate u_t's predicted rating on that item using the KNN approach described above. It will then rank these items in decreasing order of predicted rating. The top N items in this list are returned as recommendation. Your program should allow you to specify a user in the data (e.g., a user's row number in the ratings matrix) and the value of N. The output should provide understandable results including names of recommended items as well as the system's predicted rating on those items. If the user's unrated items are fewer than N, then the recommended set will include only the remaining unrated items.
-
Finally, write a program or function to evaluate the accuracy of your prediction function using Mean Absolute Error (MAE) as the evaluation metric. You can compute MAE by generating predictions for items already rated by each test user. Given a test user u and a previously rated item t, you will use the remaining ratings of user u to generate prediction for the test item t being considered. For each of these items you can compute the absolute value of the difference between the predicted and the actual ratings (i.e. the prediction error). You must repeat this process for each rated item across all test users. You can then average these errors across all test cases to obtain the MAE. You can compute MAEs for different values of K to determine the optimal value for the number of neighbors.
-
Testing your recommender:
-
To test of your program, use this book-ratings dataset. This data represents the ratings of 40 users on 8 books. Ratings for users 0 through 29 comprise the training data. Ratings for users 30 through 39 represent the test data. Only the users in the training data are used to find the K nearest neighbors of a target user and generate predictions. Test instances will be used to evaluate prediction accuracy. For this problem, you should read this data into a user-item ratings matrix with rows corresponding to user profiles (ratings given by a user to various items), and columns corresponding to items in the database. Note that, in practice, it is not scalable to convert the data into full matrix representation (instead usually a sparse matrix representation or an inverted index structure is used handle the ratings), however, for simplicity we will use the standard matrix representation to facilitate the use of basic vector operations. Note that 0 entries in the matrix represent the absence of a rating. The mapping of book ids to names in provided in the file hw3-book-names.csv. Provide the following results in your submission.
-
Show the 10 most similar neighbors to users 35 and 39 along with the respective similarity values.
-
Show the predicted ratings in each of the following cases:
User 35, item 0, K = 5.
User 39, item 6, K = 10. -
Show the top 3 recommended items for user 35, using K = 20.
-
Show the top 3 recommended items for user 36, using K = 10.
-
Using your evaluation function, compute and display the MAE obtained on the test data using K = 5.
-
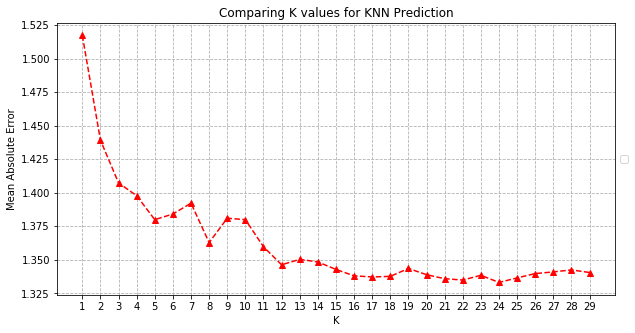
Next, repeat the above evaluation procedure, but use a range of values of K from 1 to 30. Create a table and a plot of the values of K (x-axis) and the MAE values (y-axis) to determine the optimal value of K for this test dataset. For example, you plot might look like (but will not be exactly the same as) this figure.
-
-
[Extra Credit - 10 pts] A Joke Recommender System:
For this extra credit part, your will use the recommender you created above and test with some real ratings data, specifically, with a modified version of a joke ratings dataset [See jokes.zip]. This is a modified subset of the data from the Jester Online Joke Recommender System. The data set contains two files. The file "modified_jester_data.csv" contains the ratings on 100 jokes by 1000 users (each row is a user profile). The ratings have been normalized to be between 1 and 21 (a 20-point scale), with 1 being the lowest rating. A zero indicates a missing rating. The file "jokes.csv" contains the joke ids mapped to the actual text of the jokes.
Set aside the last 100 users in the data set as test users. For each of these 100 users, randomly select 20% of the known ratings as test cases. For each test user, use the 80% remaining ratings as the input to your recommender to predict each of the set-aside 20% of ratings. Compute the MAE for each test user and then the overall MAE across all 100 test users. Do this evaluation using different values of K (e.g., 5, 10, 15, ..., 50) and see if you can determine an optimal value for K.
Use your best value of K to generate the top 3 joke recommendations for at least three different users (by specifying the user's index, the value of K, and the N=3 as the number of recommendations). In your output provide the predicted rating as well as the text of each recommended joke.
Deliverables include the following:
-
Your code [30 pts]: As in part 1, you need to implement the primary algorihtms (KNN, prediction and recommendation generation, and MAE computation on your own. But for basic data processing and numeric computations (including Pearson Correlation), you may use external libraries (for example, in Python, you may use libraries such as Numpy and Pandas).
-
5 Minute Video [10 pts]: As before, go over important components of your code, including the implementations of KNN, prediction generation, recommendation generation, and testing. Then demonstrate your programming running for several sample test cases.
-
Write up [10 pts]: Provide a detailed summary of the evaluation results described above under "Testing your recommender" [In the case of the extra credit part, provide a summary of evaluation results as well as the recommended jokes generated by the system in your test cases].