To Notes

IT 403 -- Sept 14, 2016

Review Problems

  1. What is the proper filename for project submissions?
    Ans: proj1-smithx.doc, where you replace Smith by your last name.
  2. Match these names with the definitions below:
     
         Cotes   de Moivre   Fisher   Galton   Gauss   Graunt   Pascal   Quetelet   Tukey
    1. First Stated the Central Limit Theorem
    2. Tried to find the "ideal man" that nature was trying to produce
    3. Was the first demographer
    4. Coined the term "exploratory data analysis"
    5. Father of modern statistics
    6. First described the least squares method for fitting a line to data
    7. First studied the theory of errors in astronomy
    8. First applied the theory of probability to gambling
    9. First introduced the concept of correlation for a bivariate dataset

    Ans: Cotes: g; deMoivre: a; Fisher: e; Galton: i; Gauss: f; Graunt: c; Pascal: h; Quetelet: b; Tukey: d.
  3. What do the terms inner fence and outer fence mean?
    Ans: The two inner fences are located at Q1 - 1.5 x IQR and Q3 + 1.5 x IQR. The two outer fences are located at Q1 - 3.0 x IQR and Q3 + 3.0 x IQR. Extreme outliers are located to the outside of the outer fences. Mild outliers are located between the inner and outer fences.
  4. Why are outliers important?
    Ans: Outliers could represent erroneous data, in which case they must be corrected or omitted. If correct, they might be the most important data points in the dataset. In business they can significantly affect the bottom line; in science, they might be the key to a scientific breakthrough.
  5. Draw the histogram in each case. Note: [a,b) denotes an interval that is closed on the left (includes a) and open on the right (does not include b).
     
    Caution: what does it mean for histograms (b) and (c) to have bins of different widths?

    (a)
    Bin Count
    [0,1) 1
    [1,2) 3
    [2,3) 5
    [3,4] 1
    (b)
    Bin Count
    [0,1) 3
    [1,2) 5
    [2,4] 2
    (c)
    Bin Count
    [0,1) 2
    [1,2) 4
    [2,2.5) 3
    [2.5,3] 1
  6. Compute the median for each histogram in the preceding problem by using interpolation in the bar that contains the median. Ans: Problems 5 and 6.
  7. Compute the interquartile range of the histogram of Problem 12c by using interpolation in the bars that contain Q1 (25th percentile) and Q3 (75th percentile).
    Ans: Problem 7.
  8. In Histogram (3), use interpolation to estimate the percentage of observations in the interval [0.5, 3.0).
    Ans: The area of the histogram rectangle over the interval [0.5, 1.0) has half of the area of the histogram rectangle over the interval [0,1), which is 30%. Also, the histogram area of the rectangle over the interval [2, 3.0) has half of the area of the area of the histogram rectangle over the area of the histogram area over the interval [2, 4), which is 10%. Therefore:
  9. Draw the histogram without bar lines of
    1. the incomes of all persons in the U. S.
      Ans: A skewed histogram with a peak at about 35 or 40 thousand, but with a long right tail that extends all the way past 1 billion.
       
    2. the GPAs of all students at DePaul. Ans: A bell-shaped histogram with peak around 3.0. There may be a secondary peak around 2.0, representing those students that have just come off of academic probation. The height of the histogram can only be nonzero in the range from 0 to 4.
       
    3. the number of years of schooling of all persons in the U. S. Ans: A bell-shaped peak around 12 years (most people finish highschool, less people attend college).
       
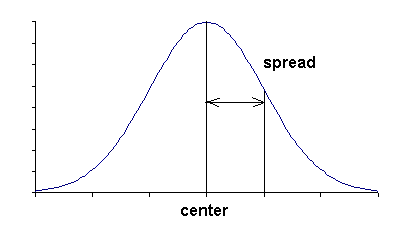
    4. the IQs of all persons in the U.S. Ans: A bell-shaped curve with center at 100 and spread 15.
  10. What do the initials SPSS mean? Ans: Statistical Package for the Social Sciences
     
  11. How do you accomplish the following in SPSS?
    1. Create a new dataset.
      Ans: Select New >> Data. Then type the data into the Data View.
       
    2. Change a variable name.
      Ans: Change the variable name in the Name columns of the Variable View.
       
    3. Add a label to a variable.
      Ans: Enter the label in the Label column in the Variable View.
       
    4. Import a dataset from an Excel file.
      Ans: Select Import >> Data. Set the filetype to .xls and open the desired Excel file. Then indicate the worksheet you want to use and whether the variable names are in the first row.
    5. Print a dataset.
      Ans: Select Analyze >> Reports >> Case Summaries. Select the variables that you want to print.
       
    6. Obtain Q0, Q1, Q2, Q3, and Q4 for a dataset.
      Ans: Select Analyze >> Descriptive Statistics >> Explore... Click the Statistics button and check the Percentiles button.
       
    7. Obtain a histogram and a boxplot.
      Ans: In addition to the answer 17f click the Plots button and select Histogram. The Stemplot is not needed.
       

Descriptive Statistics

Practice Problems

  1. What happens to x and Q2 for a dataset
    1. if every observation is increased by 7?
      Ans: Both x and Q2 are increased by 7.
      xnew = (1/n)(x1 + 7 + ... + xn + 7)
             = (1/n)(x1 + ... + xn) + (1/n)(7 + ... + 7)
             = x + (1/n) n 7 = x + 7
    2. if every observation is multiplied by 3?
      Ans: Both x and Q2 are multiplied by 3.
      xnew = (1/n)(3 x1 + ... + 3 xn)
             = (1/n)3(x1 + ... + xn)
             = 3(1/n)(x1 + ... + xn) = 3 x
    3. if the largest observation is increased by 1000?
      Ans: The mean is increased by 1000 / n, the median is unchanged if n ≥ 3.
      (1/n)(x1 + ... + (xn + 1000)) = x + 1000 / n
  2. What happens to SD for a dataset if
    1. if every observation is increased by 7?
      Ans: the SD is unchanged because the spread is unchanged.
    2. if every observation is multiplied by 3?
      Ans: the SD is multiplied by 3 because the spread is multiplied by 3.
  3. Show that the mean is the center of gravity of the dataset.
    Ans: In class we balanced a cardboard histogram on a pencil and showed that the center of gravity is the point on the x-axis where the histogram balances (does not tip to the left or right. Here is the algebraic demonstration: m is the point where the histogram balances, and x1 - m is the turning moment that tries to top the histogram to the left or right. A negative moment tries to tip the histogram to the left; a positive moment tries to top the histogram to the right. We want the moments to sum to zero so that the histogram balances.
    (x1 - m) + ... + (xn - m) = 0
    (1/n)[(x1 - m) + ... + (xn - m)] = 0
    (1/n)(x1 + ... + xnm) - (1/n) n m = 0
    x - m = 0, so m = x.
  4. Compute the 20%-trimmed mean of this dataset:
           1   7   4   6   94   5   5   7   3   6
    Ans: Trimming 10% of the variables off of the bottom and 10% off of the top, means omitting 1 and 94. The average of the remaining variables is 5.375.
  5. Without doing any calculations, compute the SD of this dataset:
     
         4   4   4   4   4
    Ans: The mean is 4; therefore the average of the squared deviations, is 0. SD = sqrt(ave of squared deviations) = 0.
  6. Without doing any calculations, compute the SD of this dataset:
         0   0   0   0   10   10   10   10
    Ans: The average is 5, so the deviations consist of four -5s and four 5s. The squared deviations are all 25, so the average squared deviation is also 5. sqrt(25) = 5.
  7. Use SPSS to compute SD+ of the hypothetical exam scores, which is Dataset 1 on the Datasets Page.
    Ans: Select Analyze >> Descriptive Statistics >> Descriptives. Make sure that the mean and SD are selected.
  8. If SD = 6.94 and the sample size n = 23, what is SD+?
    Ans: Define SS = (x1-x)2 + ... + (x23-x)2. Then SD = 6.94 = sqrt(SS / 23). Solve for SS, which gives SS = 1107.76. Then SD+ sqrt(SS / (n-1)) = SD+ sqrt(1107.76 / 22) = 7.10.
  9. Compute the MAD of this dataset:
         20    10    15    15
    Ans: x = 15, so MAD = (|20-15| + |10-15| + |15-15| + |15-15|) / 4 = 2.25. The absolute value of x, denoted by |x|, eliminates the sign from x.

Comparison of Mean and Median

Practice Problems

  1. Compute the mean of each of these histograms by using a weighted average of the midpoints of each rectangle weighted by the proportion of observations represented by that rectangle.
     
    (a)
    Bin Count
    [0,1) 1
    [1,2) 3
    [2,3) 5
    [3,4] 1
    (b)
    Bin Count
    [0,1) 3
    [1,2) 5
    [2,4] 2
    (c)
    Bin Count
    [0,1) 2
    [1,2) 4
    [2,2.5) 3
    [2.5,3] 1

    Ans: Compute the weighted average (x1 w1 + ... + xn wn) / (w1 + ... + wn) , where x1 is the midpoint of the ith bin and w1 is the number or proportion of observations in the ith bin.
    Ans for (a):  
      0.5 x 10 + 1.5 x 30 + 2.5 x 50 + 3.5 x 10   200
      ----------------------------------------- = --- = 2.0
                  10 + 30 + 50 + 10               100
    
    Ans for (b):  
    0.5 x 30 + 1.5 x 50 + 3.0 x 20    150
    ------------------------------ =  --- = 1.5
             30 + 50 + 20             100
    
    Ans for (c):  
      0.5 x 20 + 1.5 x 40 + 2.25 x 30 + 2.75 x 10   165
      ------------------------------------------- = --- = 1.65.
                       20 + 40 + 30                 100 
    

The Ideal Measurement Model

Analyze the NBS-10 Dataset

Project 2

The Normal Distribution

The Standard Error of the Average