To Notes
IT 223 -- Apr 29, 2024
Review Exercises
- R questions:
- Name all of the R functions that you know.
- What is an R dataframe?
- How do you read an R dataframe from a CSV file?
- How do you create an R dataframe from a data vector or vectors?
- What is the difference between a normal density and a uniform density?
- What is a bivariate normal density?
- What does the correlation tell you?
- What are the inner fences in a boxplot.
- What are the two methods of defining outliers?
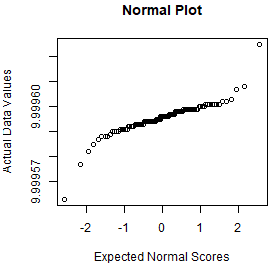
- What are normal scores?
- How do you use normal scores to create a normal plot?
- What does this normal plot tell you about the dataset?
- Create a vector x of 100 simulated normal IQ scores (mean=100 and sd=15). Then create these graphs: histogram,
boxplot, normal plot, plot is x vs. observation number. Interpret the plots.
- Here are the normal tables that will be included with your midterm exam.
Use these tables to solve the following problems:
- Human male weights are normally distributed with mean=75kg and sd=16kg. What proportion of
these weights are between 51 and 99kg?
- What proportion of these weights are greater than 163kg?
- What is the 80th percentile for these weights?
- What is the 99.99th percentile for these weights?
Review for Midterm
Project 3
- Look at the project description for
Project 3.