To Exam Info
Practice Midterm
Multiple Choice Questions
For each question, show your work or give a reason explaining your answer.
4 points for the reason, 1 point for the correct answer.
- How many statistics are needed to parsimoniously describe a univariate
normal dataset.
a. 1 b. 2 b. 4 b. 5
- Which of these variables is an example of a discrete variable?
a. class rank
b. height
c. income
d. occupation
- Find the IQR of this dataset. Use the Tukey's hinges method for
computing Q1 and Q3.
0.012 0.026 0.028 0.030 0.032 0.032
0.033 0.039 0.049 0.053 0.061
a. 0.009 b. 0.015 c. 0.032 d. 0.049
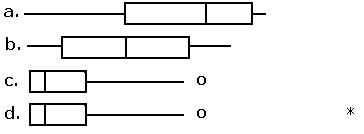
- Which of the following univariate datasets is the most skewed to the left?

- Horse pregnancies are normally distributed with a mean gestation
period of 336 days with an SD of 3 days. What percentage of horse pregnancies
last longer than 340 days.
a. 9.2 b. 42.8 d. 90.8 d. 92.0
- What IQ do you need to be in the 80th percentile?
a. 80.0 b. 106.2 d. 112.6 d. 122.8
- Which of the following is usually not a good idea with a regression equation?
a. extrapolation b. interpolation
c. prediction d. validation
- If the correlation between x and y is 0.85, then what percentage of variation in
y can be explained by the variation in x?
a. 15% b. 55% d. 72% d. 85%
- Compute the correlation of x and y.
They are already standardized (have mean=0 and SD=1).
x: 0.5 -0.5 -1.5 0.0 1.5
y: -1.5 -0.5 1.5 0.5 0.0
Your answer will be different than the correlation computed by R because
R uses SD+ instead of SD.
a. -0.55 b. -0.35 d. 0.35 d. 0.45
- Which of these statements is false about Carl Friedrich Gauss?
a. He discovered a summation formula when he was five years old.
b. He discovered the Central Limit Theorem.
c. He so alienated his sons that two of them moved to America from Germany.
d. He was the first to publish the least squared method for
obtaining a regression line.
Short Essay
For full credit, use complete sentences and paragraphs. Give examples if you wish.
Your explanation should make sense to someone that does not understand statistics,
like your mother.
- What do the sample mean and SD tell you about a dataset?
- Why is correlation not always the same as causation?
Problems
Show all of your work. You may use a calculator.
- Given this table of grouped data for a histogram, do the following:
| Bin | Percentage of Observations |
| [1,3) | 30% |
| [3,4) | 40% |
| [4,5) | 10% |
| [5,7) | 10% |
| [7,11] | 10% |
- Give the heights of the histogram bars. The units of the heights
are percent per horizontal unit. You do not need to submit
your drawing of the histogram.
- Compute Q1, Q2, Q3 and IQR.
- Compute the mean using a weighted average.
- What percentage of the observations are between 4.5 and 7.0?
- Pick 5 numbers that have a median of 4 and a mean of 7.
Show or explain how you chose the numbers of the dataset.
- Compute the SD+ of this dataset by hand:
3 4 1 8 5 4
R Analysis
Write R statements to perform the following analyses. Interpret the output.
- The dataset
lake-michigan-levels.xls contains the variables year and waterLevel
in feet above sea level.
- Create labels for the variables in the dataset.
- Print the dataset including both year and waterLevel.
- Determine these univariable statistics Q0, Q1, Q2, Q3, Q4, mean, SD,
SE(ave).
- Determine a 95% confidence interval for the true water level.
- Graph the boxplot. Are there any outliers?
- Graph the normal plot. What does the normal plot tell you?
- Plot the water level vs. year. Does the plot appear unbiased and homoscedastic?
