To Lecture Notes
CSC 423 -- 7/17/17
Course Documents
- Announcements, Professor Information, Lecture Notes,
Documents, Exam Info, Projects, Syllabus, Submit Homework
Collect Micrometer Paper Thickness Measurements
- Use the instructor's micrometer to measure the thicknesses of the two sheets of paper
(Blue and White)
that the instructor will give you.
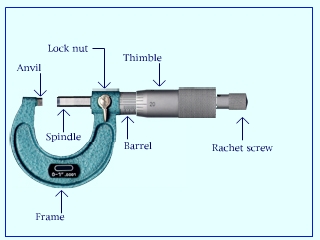
- This micrometer measures thicknesses to the nearest thousandth of a millimeter
(nearest micrometer = 10-6 m).
- Before you make each measurement,
make sure that the units are set to mm, not to inches (use the mm/in button to change units if necessary),
close the distance between the spindle and the anvil until they are almost touching,
tighten the spindle with the ratchet screw, so that the spindle and anvil touch the sheet of paper being measured,
zero out the distance on the digital display (ON/OFF 0 Button).
- When you measure each paper thickness, use the ratchet screw to obtain an accurate reading.
- Write your name and measured thickness in mm on each sheet of paper.
- These paper thickness measurements will go into a dataset that you will
analyze for Project 1.
Course Topics
- Major Themes
Regression Modeling Statistical Software
Diagnostic Plots
- Math Prerequisites
IT 403 or another first statistics course
College Algebra (We will use a little Calculus but it is not a course prereq.)
- Review of topics from IT403
Mean
Median
Standard Deviation
Histogram
Boxplot
Normal Plot
Scatterplot
Linear Correlation
Simple Linear Regression
- Tests of Hypothesis
z-test
t-test
Paired-sample tests
Independent two-sample tests
t-tests and F-tests for regression
- Simple and Multiple Linear Regression Models
- Horizontal Line Regression:
- Regression through the Origin:
- Simple Linear Regression:
- Simple Linear Regression with log-log Transform:
log yi = a + b log xi + εi
- Quadratic Regression:
yi = a + b xi + c xi2 + εi
- Linear Regression, Two Independent Variables:
yi = a + b x1i + c x2i + εi
- Full Quadratic Regression, Two Independent Variables:
yi = a + b x1i + c x2i +
d x1i2 +
e x1i x2i +
f x2i2 + εi
- Matrix Form of Linear Regression Model:
- Regression Diagnostics
Residual Analysis
Influence Points
Model Selection
- Analysis of Variance (ANOVA)
Categorical Independent Variables (also called Dummy Variables)
- Logistic and Poisson Regression
Categorical Dependent Variable
Review Questions
- Give examples of continuous variables and categorical variables.
Ans: A continuous variable can take on any value in a range (subject to roundoff error).
Examples are height, stock price, price, voltage, IQ, or paper thickness.
A categorical variable
(also called a nominal or discrete variable) is often not a number.
A categorical variable can only take on a small number of discrete values. Examples of categorical variables are gender,
employment status, dog breed, country of origin.
A third type of variable is an ordinal variable, which is a compromise between continuous and categorical.
They can be ordered but are not continuous. For example, year in school (freshman, sophomore, junior, senior), military rank,
letter grade for a course.
- Explain the difference between a population and a sample.
Ans: A population is the entire set of entities from which inferences are to be drawn. Examples of populations are
adult women in the U.S., insurance companies in California, heights of fifth grade boys in California, SAS scores in Illinois,
lifespans of Golden Retriever dogs, fish in Lake Michigan. A sample is a small subset of the population and can be used to
perform a statistical test. For valid statistical inferences, the sample must be a simple random sample, which means that every entity
in the population is equally likely to be included in the random sample.
With the advent of big data, the distinction between a population and a sample is blurred; presently it is not uncommon for a company
to collect data for an entire population (for example the customers that shop at Walmart). However, even if data for an entire population
is collected, it is still common to extract a random sample from this data when studying some aspect of the entire population would
be to time consuming or costly.
- What is the name of each of these Greek letters? What do they represent in statistics?
Ans:
α: alpha, is the size or type 1 error of a statistical test (the probability of rejecting the null hypothesis when it is true). The most commonly used value for α is 0.05.
β: beta, represents parameters of a regression equation.
ε: epsilon, represents the random errors or residuals in a regression model.
μ: mu, is the population mean. If the normal distribution is used, μ is the center of the normal density.
ρ: rho, is the population correlation.
σ: sigma, is the population standard deviation. σ2 is the population variance.
θ: theta, is an unspecified parameter in a probability density. Used for theoretical discussions and definitions.
χ: chi, denotes the χ2 (chi-squared) distribution.
- What is a random variable?
Ans: The formal definition of a random variable X is a function from the sample space Ω into the set of real numbers:
I prefer a more informal definition: a random variable is a process for choosing a random number.
- Rewrite the expression
x1 + x2 + ... + xn
using summation notation.
Ans:
Σi=1n xi
- Write the definitions of the sample mean x and
the sample variance sx2 in summation notation.
Ans: (1/n)
Σi=1n
xi and
[(1/(n-1)] Σi=1n (xi -
x)2
Notes: in the definition of s2, the sum of squared deviations is divided by n-1 instead of n so that the sample variance s2
is an unbiased estimator of the population variance σ2:
- Find the calculus derivative of each of these expressions:
Ans: Use the formulas (d/dx)(xn) = n xn-1 and (d/dx)(cy) = c (d/dx)(y).
(d/dx)(7x2) = 7(d/dx)(x2) = 7(2x1) = 14x.
(d/dx)(4x) = 4(d/dx)(x1 = 4(1x0) = 4.
(d/dx)(19) = 19(d/dx)(x0) = 19(0x-1) = 0.
To compute the last derivative, we need the chain rule: dy/dx = (dy/du)(du/dx).
Let y = 4(3 - 5x)2 and u = 3 - 5x.
(d/dx)(4(3 - 5x)2) = (dy/du)(du/dx) = (d/du)(4u2) (d/dx)(3 - 5x) = 8u(-5) = 8(3 - 5x)(-5) = -40(3 - 5x)
- (Needed for Project 4) Compute the partial derivatives ∂y/∂x1 and ∂y/∂x2
for this expression:
y = 3x12 + 5x1x2 - x22 + 7x1 + 8x2 + 35
Ans: To compute the partial derivative ∂y/∂x1, x1 is the variable and x2 is treated as
a constant.
∂y/∂x1 = 3(2x1) + 5(1x2) + 7(1) + 8(0) + 0 = 6x1 + 5x2 + 7
∂y/∂x2 = 5(2x1) + (-1)(1x2) + 7(0) + 8(1) + 0 = 5x1 - x2 + 8
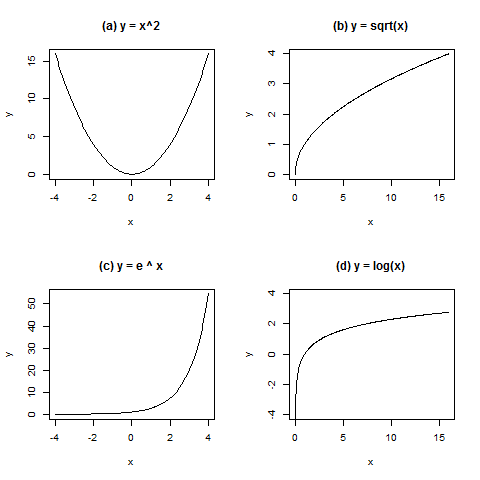
- Sketch the graphs of these functions:
y = x2
y = √x
y = ex y = ln x
Here are these graphs drawn by R.
- Define these terms:
Discrete Random Variable
Continuous Random Variable
Continuous Probability Density
Normal Distribution
Ans:
Discrete Random Variable: A random variable that can take on only a finite set of numeric values.
Continuous Random Variable: A random variable that can take on any value in an interval, possibly infinite like this: (-∞, ∞).
Continuous Probability Density: A positive function that is used to obtain probabilities for continuous random variables. To find
P(a ≤ x ≤ b) compute the area between a and b under the probability density.
If the function for the probability density is integrable, use calculus
integration to find the area under the curve. If this function is not
integrable, statistical tables or software such as SAS or R is needed to
compute this area. See the
Random Variable Properties and
Technical Details for more explanation.
Normal Distribution: The well known bell-shaped curve. It has the
probability density
φ(x) = (1 / √2π) exp((x - μ)2/(2σ2))
- What is the Central Limit Theorem (CLT) and why is it important in statistics?
Ans: The CLT states that even if n independent observations from a population do not have a normal distribution,
the sample mean of the observations is approximately normally distributed if n is large. Usually we consider n to
be large if n > 30, but this depends on the original distribution. If the observations are Bernoulli, with
p close to 0 or 1, then n must be substantially larger than 30 for the CLT to apply.
Confidence Intervals for the Population Mean (μ)
- If we know that the population, as modelled by the random variable x, is normally distributed we can use the sample mean
x and the sample standard deviation sx to estimate the population
parameters μx and σx.
- The error of the mean is defined by
where n is the sample size and σx is the standard deviation of the sample mean.
- Because σx is unknown, the standard error of the mean is estimated by replacing
σx by sx:
- Because of the Central Limit Theorem, if the sample size n is large (rule of thumb > 30),
the sample mean will be approximately normally distributed, even if the population is not.
This means that we can use the normal distribution table to obtain confidence intervals for the
unknown population mean μ, even if the original sample is not normally distributed.
- For the sample mean treated as a random variable
68% of the observations are located within one standard error of the population mean.
95% of the observations are located within two standard errors of the population mean.
99.7% of the observations are located within three standard errors of the population mean.
- Practice Problem (data from Mendenhall and Sincich, p. 35)
A psychologist records the total parental attention time in hours within one
week for pairs of 2 1/2 year old twins. Here are the results:
n = 50 x = 20.85 sx = 13.41
Find a 95% confidence interval for the population mean value of parential attention time.
Solution: The standard error for the sample mean is SEmean = sx / √n =
13.41 / √50 = 1.896. The z-score for the sample mean is
z = (x - μ) / SEmean = (20.85 - μ) / 1.896
(*)
Using the central limit theorem, since n is large (> 30), the sample mean and it z-score are approximately normally
distributed, so 95% of the time,
or more accurately,
Now use the value for z in (*) and solve the inequalities for μ:
-1.960 ≤ (20.85 - μ) / 1.896 ≤ 1.960
-3.716 ≤ 20.85 - μ ≤ 3.716
-24.57 ≤ -μ ≤ -17.13
24.57 ≥ μ ≥ 17.13 or
17.13 ≤ μ ≤ 24.57.
The 95% confidence interval is [17.13, 24.57].
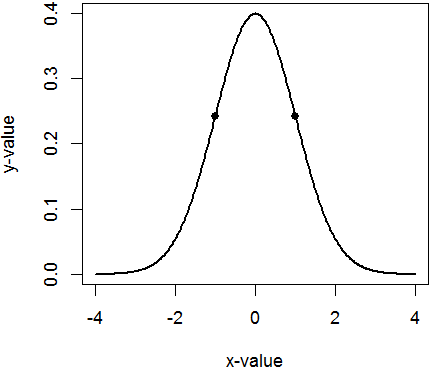
The Standard Normal Density
- The standard normal density is the normal density with μ = 0 and σ = 1. Here is a
graph of the standard normal density, plotted with this R script:
x = seq(-4, 4, 0.01)
y = dnorm(x)
plot(x, y, type="l")
To specify that z has a standard normal density, we write z ∼ N(0, 1).
In general, x ∼ N(μ, σ2) means that x has a normal density with mean = μ
and variance = σ2.
An inflection point are the points x on a curve f(x) where the second derivative equals zero: f"(x) = 0.
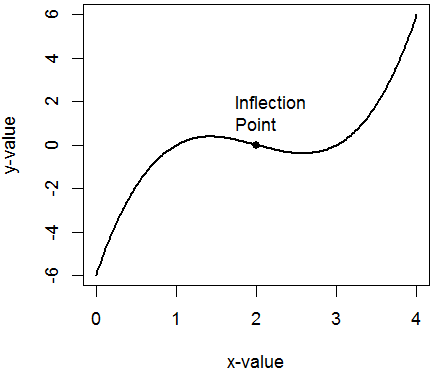
Inflection points are where the concavity of the curve changes from concave up to concave down, or vice versa.
On the standard normal curve, the inflection points are located one standard deviation away from the mean at x = ±1:
For an arbitrary normal density, the inflection points are located at x = μ ± σ.
Introduction to SAS and R
- SAS has good built in capability for presenting the results of statistical analyses.
- R is a good programming language for customizing statistical calculations
and for performing interactive calculations.
- Introduction to SAS
- Introduction to R
- ExamSco Example
The NIST Example
- NIST Example (National Institute of Standards and Technology).
- The job of the NIST to weigh the country's prototype weights to insure that the scales to measure
these weights, the storage conditions, and the weighing procedures are all working properly.
- In spite of extreme care, sometimes a prototype weight will gain or lose weight unexpectedly, as this
article discusses:
Normal Plots
There exist formal tests of hypothesis to check if a given sample comes from a normal distribution.
Sas provides the results of these tests with proc univariate.
The NIST Example shows the
SAS output of the
Kolmogorov-Smirnov, Cramer-von Mises, and Anderson-Darling tests for normality.
To interpret these tests at the 0.05 level of significance. If p < 0.05, reject the null hypothesis
that the sample comes from a normal distribution; if p > 0.05, accept it.
The problem with tests of normality in general is that it is difficult to find a test statistic that
distinguishes normal from non-normal distributions in all cases, especially for small samples.
Most statisticians find the normal plot to be more useful than tests of normality for checking whether
a sample has an approximately normal distribution.
The Boxplot
- We did not discuss this section on class. Read it if you need a review on the details of boxplots.
- The boxplot was invented in 1969 by the Princeton
statistician John W. Tukey (1915 - 2000).
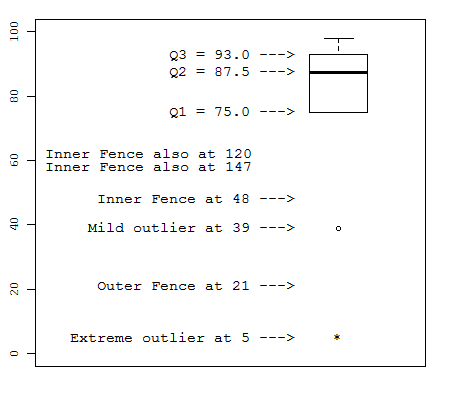
- The boxplot shows this information for a dataset: the first quartile Q1, the second quartile Q2, and the
third quartile Q3, extreme outliers marked by *, and mild outliers marked by O.
Here is an example boxplot for the hypothetical exam scores
5 39 75 79 85 90 91 93 93 98
- Let n be the number of observations, and let x(i) be the ith observation of the sorted dataset.
Then Q1, Q2, and Q3 can be defined by the Tukey's Hinges method like this:
Q2 is the 2nd quartile = 50th percentile = the median. It is the middle observation x(n+1)/2
of the sorted dataset when n is odd. It is the average of the two middle observations
(xn/2 + xn/2+1) / 2 when n is even.
Q1 is the 1st quartile = 25th percentile. The Tukey's Hinges method defines Q1 as the median of the bottom half of the data,
where the bottom half of the data is defined by x(1), ... , x(n/2) when n is even.
The bottom half of the data is defined by x(1), ... , x((n+1)/2) when n is odd. Note that when
n is odd, the middle observation of the dataset is included in both the bottom half and the top half of the data.
Q3 is the 3rd quartile = 75th percentile. The Tukey's Hinges method defines Q3 as the median of the bottom half of the data,
where the bottom half of the data is defined by x(n/2+1), ... , x(n) when n is even.
The bottom half of the data is defined by x((n+1)/2), ... , x(n) when n is odd.
Note that when n is odd, the middle observation of the dataset is included in both the bottom half and the top half of the data.
- There are several other methods for computing percentiles of datasets. R provides nine different methods for computing percentiles;
SAS provides five different methods of computing percentiles. Here is a link to the help page of the R quantile function.
Projects
Tests of Hypothesis
These last three sections on hypothesis tests will be discussed next time on
Wednesday, July 19.
- Some sample research questions:
- Do vaccines for children cause autism?
- Do the electric and magnetic fields in high voltage electric power lines
cause health risks for those living nearby?
- Is there a difference in network traffic speed between our existing router,
and the new router that management is considering?
- Is the level of mercury intake for wading birds in the Florida Everglades declining? (Mendenhall and Sincich, p. 49)
- Does being on a low-fat diet cause people to lose more weight than those on a regular diet? (Mendenhall and Sincich, p. 53)
- Do red light cameras installed in a traffic intersection affect the number of vehicle collisions
in that intersection? (Mendenhall and Sincich, p. 53)
- These research questions phrased as null hypotheses:
- There is no significant difference between the rate of autism for vaccinated children vs. the rate of autism for non-vaccinated children?
- There is no significant difference between the incidence of cancer higher for persons living close to electric power lines vs.
the rate of cancer for persons that to not live close to electric power lines?
- There is no significant difference in network traffic speed between our existing router and the
proposed new router?
- There is no significant difference of mercury intake for wading birds in the Florida Everglades
between last year and this year?
- There is no significance of difference in weight loss between people on a low-fat diet
vs. those on a regular diet?
- There is no significant difference in the occurrence of vehicle crashes between
those intersections that have red light cameras installed vs. those that do not.
- Usually the researcher wants to reject the null hypothesis to show that the effect being investigated causes a real difference,
and is not just chance variation.
Some Terminology
- A simple random sample consists of randomly selected subjects from a population where every subject is equally likely to be selected.
- A treatment group is a group of subjects that are
manipulated using a medicine, chemical, or other process being investigated.
- A control group is a special type of treatment group. It receives no special medicine, chemical, or process, but leaves
the random sample as is.
- To prevent a patient from knowing whether he or she is in the treatment or control group, patients in clinical trials are usually given
a placebo.
- A statistical experiment with two treatment groups can have a treatment group and a control group or two different treatment groups.
- The response variable is the outcome or measurement obtained from a statistical experiment.
- A one-sample test of hypothesis tests whether there is a
significant difference between the responses of the treatment group and the responses
of the general population. The response of the population value is
obtained from a previous studies, expert knowledge, or theoretical calculations.
- For a one-sample z- or t-test, the null hypothesis (H0) states that the variation in the test statistic is just chance variation.
- For a one-sample z- or t-test, the alternative hypothesis (H1) states that the
the difference between the test statistic and zero is too large to plausibly be
chance variation (the difference is significant).
- A two-sample test of hypothesis tests whether there is a significance between the responses of the two treatment groups.
A paired two-sample test has a natural pairing between the subjects in the two treatment groups.
Necessarily, in this case, the two groups must be the same size.
An independent two sample test has no natural pairing between the subjects.
The two treatmant groups need not be the same size.
- For a two-sample test, the null hypothesis (H0) states that the difference between the treatment groups is due to
chance variation; there is no significant difference between the groups.
- For a two-sample test, the alternative hypothesis (H1) states
that difference between the treatment groups is too large to plausibly be chance variation (the difference is
significant).
- A test statistic T is a value computed from the data and the null hypothesis. For a
one-sample z-test, the test statistic is
- The level α of a test of hypothesis is the probability of rejecting H0
if, in fact, H0 is true. Traditionally, the level of a statistical test is taken to be 0.05
or 0.01.
- A 100(1-α)% confidence interval I is an interval
such that T ∈ I 100(1-α)% of the time
if H0 is true.
- The p-value of a statistical test is the probability of obtaining a test statistic value as extreme or more extreme
than the value actually obtained, given that H0 is true.
- The rejection region for a statistical test is the set of values of the test statistic T that lead the researcher to reject
the null hypothesis H0 and accept the alternative hypothesis H1. For any value of T in the rejection region,
p < α, where p is the p-value and α is the level of the test.
- The acceptance region for a statistical test is the set of values of the test statistic T that lead the researcher to accept
the null hypothesis H0 and reject the alternative hypothesis H1. For any value of T in the rejection region,
p ≥ α, where p is the p-value and α is the level of the test. If H0
is accepted, it does not necessarily mean that the researcher believes it is true,
it may only mean that there is not enough evidence to reject H0.
- The power of a statistical test is the probability of rejecting H0
(whether is it is true or false). Increasing the sample size always increases the power of the standard statistical tests.
The Five Steps of a Hypothesis Test
- State the null hypotheses H0 and the alternative hypothesis H1.
- Compute the test statistic T.
- Compute a (1-α)100% confidence interval I for the test statistic T, where α
is the level of the hypothesis test.
- If T ∈ I, accept H0 (and reject H1); if T ∉ I, reject H1 (and accept H0).
- Compute the p-value for T. In most cases p must be computed using statistical software.
T-tests of Hypothesis for One or Two Groups