To Notes

IT 223 -- Apr 8, 2024

Review Problems

  1. Compute Q1, Q3, IQR for this sorted dataset, using the Tukey's Hinges method.
    13  27  35  39  53  121  983 
    
    Ans: Q2 is the middle number 39, Q1 is the median of the bottom half of the data 31, Q3 is the median of the top half of the data 43 . Recall that if n, the number of observations, is odd, that the middle number is included in both the bottom half and the top half. IQR = Q3 - Q1 = 43 - 31 = 12.
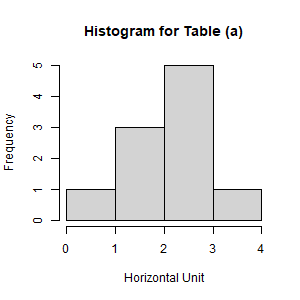
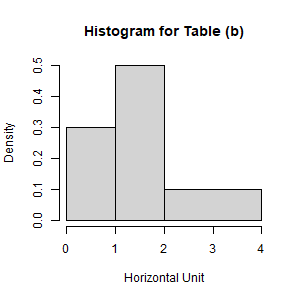
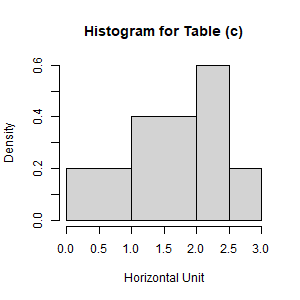
  2. What information is obtained from a boxplot
    Answer: Q0, Q1, Q2, Q3, Q4, and any outliers.
  3. What do the terms inner fence and outer fence mean?
    Ans: The two inner fences are located at Q1 - 1.5 x IQR and Q3 + 1.5 x IQR. The two outer fences are located at Q1 - 3.0 x IQR and Q3 + 3.0 x IQR. Extreme outliers are located to the outside of the outer fences. Mild outliers are located between the inner and outer fences. Boplots produced with R use o to mark all outliers, both extreme and mild.
  4. Why are outliers important?
    Ans: Outliers could represent erroneous data, in which case they must be corrected or omitted. If correct, they might be the most important data points in the dataset. In business they can significantly affect the bottom line; in science, outliers might be the key to a scientific breakthrough.
  5. Draw the histogram in each for tables (1), (2), and (3). [a,b) denotes an interval that is closed on the left (includes a) and open on the right (does not include b).

    Caution: what does it mean for histograms (b) and (c) to have bins of different widths?
    Answer: If the bars of a histogram have unequal widths, the area of a bar represents the frequency (the number of observations in the interval under the bar).  The height of each bar is then frequency per horizontal unit. For unequal bin widths, the height of a bar is called the density.

             Table (a)          Table (b)        Table (c)
    Bin Count
    [0,1] 1
    (1,2] 3
    (2,3] 5
    (3,4] 1
    Bin Count
    [0,1] 3
    (1,2] 5
    (2,4] 2
    Bin Count
    [0,1] 2
    (1,2] 4
    (2,2.5] 3
    (2.5,3] 1

    Answer: here are the histograms drawn by R:
          Table (a)  Table (b)  Table (c)
    When R creates a histogram, if the bin widths are all the same, as in the histogram for Table (a), the vertical axis is Frequency; if the bin widths are not the same as is the case for the histograms for Table (a) and Table (c), the vertical axis is Density, which means is percent per horizontal unit.
  6. Compute the median for each histogram in the preceding problem by using interpolation in the bar that contains the median. Answer for Exercise 6.
  7. Compute the interquartile range of the histogram of Problem 12c by using interpolation in the bars that contain Q1 (25th percentile) and Q3 (75th percentile). Answer for Exercise 7.
  8. In Histogram (3), use interpolation to estimate the percentage of observations in the interval [0.5, 3.0).
    Answer: The area of the histogram rectangle over the interval [0.5, 1.0) has half of the area of the histogram rectangle over the interval [0,1), which is 30%. Also, the histogram area of the rectangle over the interval [2, 3.0) has half of the area of the area of the histogram rectangle over the area of the histogram area over the interval [2, 4), which is 10%. Therefore:
  9. Draw the histogram without bar lines of
    1. the incomes of all persons in the U. S.
      Answer: A skewed histogram with a peak at about 35 or 40 thousand, but with a long right tail that extends all the way past 1 billion.
    2. the GPAs of all students at DePaul. Answer: A bell-shaped histogram with peak around 3.0. There may be a secondary peak around 2.0, representing those students that have just come off of academic probation. The height of the histogram can only be nonzero in the range from 0 to 4.
    3. the number of years of schooling of all persons in the U. S. Answer: A bell-shaped peak around 12 years (most people finish highschool, less people attend college).
    4. the IQs of all persons in the U.S. Answer: A bell-shaped curve with center at 100 and spread 15.

Descriptive Statistics