|

|
|
Basic Correlation Analysis DescriptionCorrelation analysis is a basic statistical approach that can capture relationships among pairs of variables. Such variables ususally represent properties of objects whose values may be stored in columns of a database table. For example, in a database containing customers, we may want to measure the correlation between the variables "Age" and "Income" or between the variables "Income" and "TotalPurchase", and so on. Correlations among variables can be negative or positive. There are different ways of computing correlations, but in most cases, the correlation is measured as a coefficient ranging from -1 to 1. A value close to 0 in this range indicates a lack of correlation. Values closer to the boundries -1 or 1 indicate strong negative or positive correlations, respectively. Usually (though not exclusively) strong positive or negative correlations may indicate a causal relationship between the variables. For example, there may be a positive correlation between the number of hours of studying for an exam and the score obtained in that exam.
Computing the Correlation Coefficient
Given two variables x and y (e.g., "Age" and "Income"), the correlation
coefficient for x and y is given by the ratio of the covariance of
x and y to the product of standard deviations of x and y.
In other words:
The covariance cov(x, y) is the average of the products of deviations
from the mean in each of x and y:
In the above, each xi represents the value of x in the
ith row,
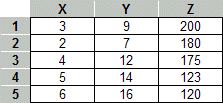
ExampleAs an example consider the following table with 3 attributes X, Y, and Z.

Performing the above correlation computation among all pairs of variables, would
result in the following correlation matrix:  Note that the diagonal is always 1 because each variable is perfectly correlated with itself. In this case, there is also a perfect correlation between X and Y (after rounding). However, Z shows a strong negative correlation to both X and Y. Correlations in Microsoft ExcelIf the data is available in an Excel spreadsheet, standard statistical functions in Excel can be used to compute correlations. One option is to use the function CORREL in Excel directly. This function takes as arguments two arrays (for example the data columns for X and Y in the above example) as defined by address ranges. The function returns the correlation coefficients as in the above example. In this case, the coefficients must be computed for each pair of variables. Another option is to use the "Data Analysis" component of Excel. This is available under the Tools menu item. If this item cannot be found, then it must not have been installed with Excel. However, it can be added from the original installation source. Use the Excel Help files to familiarize yourself with various statistical functions, including CORREL, STDEV (for standard deviation), COVAR (for covariance), as well as with the Data Analysis tools in Excel.
|
||
Copyright © Bamshad Mobasher, DePaul University. |
||