Intelligent
Information
Retrieval
CSC 575
Assignment 4
Due: Wednesday, March 8, 2023
Part 1. Text Categorization
In this problem you will explore two approaches for automatic text categorization (a.k.a.
document classification). You will first implement a basic multinomial Naïve Bayesian
classifier. Then you will implement a simple document classifier based on the Rocchio method (adapted
for classification). For both methods you will use this modified
subset of BBC News stories to train and test your classifiers. The
assignment dataset consists of an already processed set of 2225 documents from
the BBC news website corresponding to stories in five topical areas from
2004-2005. Each document is represented as a feature vector over a set of 6167
features (after tokenization, stop word removal, stemming, and frequency
filtering). Each document belongs to one of 5 classes (business, entertainment,
politics, sport, tech). The data has already been split (80%, 20%) into training and test data both of which are
provided in document x term matrix format containing a row for each document and a column
for each feature in the vocabulary (note, however, that the first column of each
row represents the documeet id in the original dataset, and this column should
be removed to get the doc-term frequency matrices). The class
labels for instances in the training and the test data are provided in separate
files. Also, the set of features used in the data (representing the columns in
the train and test matrices) is provided as a separate file. Please be sure to read the readme.txt file in the distribution for a more
detailed description of the data.
- [40 pts] Document Categorization Using Naïve Bayesian Classifier)
Implement your own version of a Naïve Bayesian classifier. Your program
should consist of two separate components: training and test. The training
component, NB_Train(train_matrix, train_class_labels),
learns from the training data by computing the priors for each class and the
conditional (posterior) class probabilities associated with different features
(in this case terms in the vocabulary). The test component,
NB_classify(posteriors, priors, test_instance), uses the learned model (posterior and prior
probabilities returned by the training function) to classify a
test instance that was not used for training. Your program should work for any
number of classes and not just for the number of classes in the provided data set.
Note: to avoid floating point
underflow, you should use the sum of log probabilities when
computing the class labels using Bayes's rule (for uniformity, please
use natural log when computing the log probabilities).
Your task is to train your classifier using the provided training
data. Then you need to evaluate your classifier using the provided
test data. For the latter task you should create an evaluation
function to measure the accuracy of your trained classifier on the
full test set. This
function will apply your learned model returned from the training
component to predict a class label for each of the test instances in the test data.
Then for each test instance, it compares the actual test class label to the predicted class
label. Your evaluation function should return the overall Classification
Accuracy (ratio of correct predictions to the number of test
instances in the full test set). It should also have the option to output the predicted
class labels together with the sum of log
probabilities for a portion of the test data (this is
to illustrate that your classifier is working properly). Your
program should also provide the capability to view the learned class
probabilities for each class label and the posteriors for specified terms (again, this is to provide
optional intermediate results demonstrating the proper functioning
of your training function). In addition to your code, provide the
following outputs as part of your submission (clearly identify which output
corresponds to which part of the problem):
- After training your classifier, provide the prior probabilities
associated with each class label.
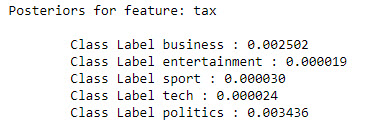
- Based on your trained model, provide the posteriors (conditional
class probabilities) for each of the following features: "hollywood", "footbal", "comput",
"labour". Note that this
is Pr(feature | class) for each class. Here is
an example output using the term
"tax".
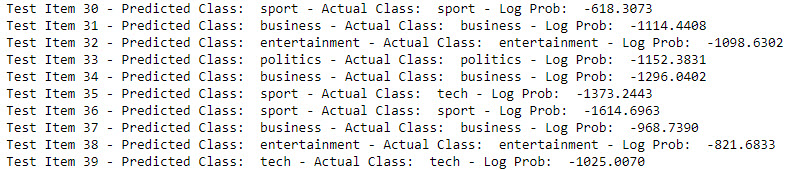
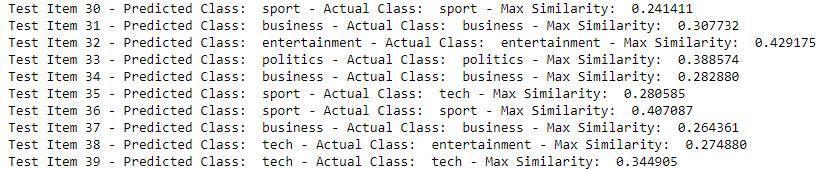
- Provide an output showing actual and
predicted class labels for the first 20 document instances
(instances 0-19) in the test data along with the log
probability values for each test instance. For example, see
this sample output for test instances
30-39.
- Using your evaluation function provide the overall classification
accuracy across all test instances.
- [20 pts] Document Categorization Using Rocchio Method
Implement your own version of the Rocchio method for text
classification discussed in class (See:
Text Categorization - Part 1). This is a simple
algorithm, but often produces good results in text classification tasks. You will train and test
your implementation using the same BBC News dataset
used in the previous problem. As before, you should separate the training
function from the classification function. The training part for the
classifier can be implemented as a function that takes as input the training
data matrix and the training labels, returning the prototype vectors for
each class. The classification part can be implemented as another function
that would take as input the prototypes returned from the training function
and the instance to be classified. This function should measure Cosine
similarity of the test instance to each prototype vector. Your output should
indicate the predicted class for the test instance and the similarity values
of the instance to each of the category prototypes. Also, as in the previous
problem, you should create an evaluation function that iterates over all
test instances and report the overall classification accuracy. Your program
should work for any number of classes and not just for the number of classes
in the provided data set. Note: for this problem do not
perform TFxIDF transformation of the data. You should use the original raw
term counts in the provided training and test data sets. In addition to your
code, provide the following outputs as part of your submission (clearly
identify which output corresponds to which part of the problem):
- Provide an output showing actual and
predicted class labels for the first 20 document instances
(instances 0-19) in the test data along with the similarity of the test instance to the most similar class prototype. For
example, see this sample output
for test instances 30-39.
- Using your evaluation function provide the overall classification
accuracy across all test instances.
Part 2. Hyperlink Analysis
In this part of the assignment you will explore well-known, simple, yet powerful hyperlink analysis methods.
Specifically, you will implement your own versions of the HITS algorithm (Hubs and Authorities)
and the PageRank algorithm.
For this problem, you should not use external libraries that directly compute
PageRank or hubs/authorities for a graph. For the purposes of this problem, you
can represent a directed graph with an adjacency list (for each node p
in the graph representing a Web page, the
adjacency list for that node includes
all the nodes to q to which p points i.e.,
there is a directed edge from p to q). For
example, the simple directed graph, G, given below:
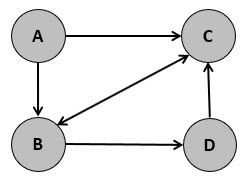
may be represented using the folllowing adjacency list:
G = {
    'A': ['B','C'],
    'B': ['C','D'],
    'C': ['B'],
    'D': ['C']
}
A bidirectional edge between nodes p and q
in the graph represents two edges, one for p to q
and one from q to p. Alternatively,
you can use an adjacency matric to represent the graph (however, this type of
representation may not be scalable for large graphs). Your program should work
for any input graph, given an appropriate representation for the graph.
- [20 pts] PageRank
Implement the iterative version of PageRank algorithm given in lecture notes on
Hyperlink Analysis (see slide 46). Your implementation should include a
function PageRank(G, alpha, num_iter) that takes the
representation of any graph G, the PageRank damping factor,
alpha, and maximum
number of iterations, num_iter, and returns a vector R of
PageRank values for each node in the graph (after the max number of
iterations). Your function may optionally provide intermediate PageRank vectors
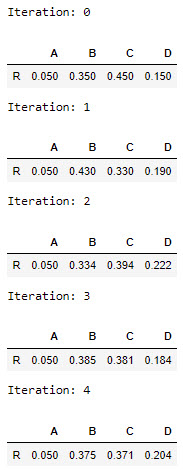
at the end of each iteration (after the normalization step). For
instance, using PageRank(G, 0.25, 5) with the above example
graph may produce something similar to this
sample output.
To demonstrate your program, submit the output of
your program on the
following graph, G1, using alpha = 0.5 and
number of iterations = 5.
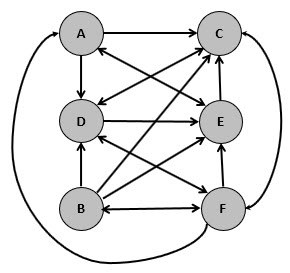
The
adjacency list for the graph is given below:
G1 = {
    'A': ['C','D','E'],
    'B': ['C','D','E','F'],
    'C': ['D','F'],
    'D': ['C','E'],
    'E': ['A','C'],
    'F': ['A','B','C','D','E']
}
- [20 pts] HITS Algorithm (Hubs and Authorities)
Implement the iterative version of HITS algorithm given in lecture notes on
Hyperlink Analysis (see slide 27). The main component of your implementation
should be a function, HITS(G, num_iter) which takes, as
input, the representation of any graph G and the maximum number
of iterations, num_iter, and returns two vectors: a vector A representing
authority values for each node and a vector H representing the
hub values for each node. These vectors represent the updated hub and authority
values for the nodes in the graph after num_iter update cycles.
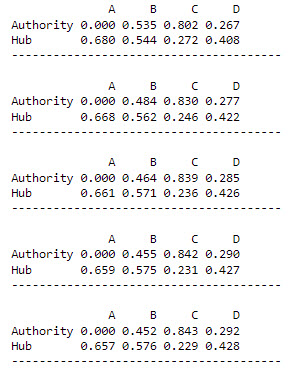
Your function may optionally display intermediate hub and authority vectors at
the end of each iteration (after the normalization step). You may find it
helpful to have helper functions for updating the hub and the authority vectors
during each iteration in the main function. As an example, using HITS(G,
5) with the aforementined example
graph, G, may produce something similar to
this
sample output.
To demonstrate your program, submit the output of
your program on the graph G1, from the previous problem, using
num_iter = 5.
Back to Assignments/strong>
|
