Intelligent
Information
Retrieval
CSC 575
Assignment 3
Due: Sunday, February 19, 2023
- [50 pts] Query Expansion and Relevance Feedback
In this problem you will explore different approaches to query
expansion and modification. First, you will implement the Rocchio's method
for relevance feedback in vector space retrieval models (parts a-c below).
Then, you will explore the idea of Automatic Global Analysis for query
expansion based on associated terms (parts d-e below).
We assume
that we have a set of documents that have already been preprocessed (basic
tokenization and stemming) with each document given as a single line in a
text file. For testing purposes, we will use
this set of test documents.
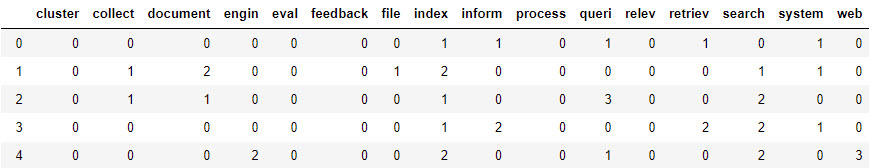
- First, read in the documents and create a document by term matrix
(with 15 documents as rows and 16 unique terms as columns with entries
corresponding to raw term counts in each document. Be sure to organize
your matrix so that terms (or term indices) are listed in alphabetical
order. The first 5 documents in the matrix (documents 0 through 4)
should look like this table.
Provide the full document-term matrix in your submission. Note that your
program should be general and work with any set of N documents and M
terms, generating a NxM matrix.
- Next consider a query Q = "relev feedback queri relev"
issued by a hypothetical user, and suppose that after getting back the
search results the user provides relevance feedback on the following
documents
Relevant docs (R): [0, 2, 8, 13]
Non-relevant docs (NR): [6, 7, 14]
Write a
function modify_query(Q, R, NR, alpha, beta) that
returns a new query vector (over terms) using Rocchio's relevance
feedback method. The parameters for this function are described below:
Q: the original M-dimensional query vector. For
example, the above query Q will result in the following vector:
Q = [0, 0, 0, 0, 0, 1, 0, 0, 0, 0, 1, 2, 0, 0, 0, 0]
or, in more readable form as
this vector with term dimensions displayed.
R: The set of documents identified as relevant by the user (this
may be represented a submatrix of the original doc-term matrix with only
the relevant documents included).
NR: The set of
documents identified as non-relevant by the user.
alpha
and beta: positive and negative feedback coefficients
(weights), respectively.
You may find it useful to write a helper
function to compute the centroid vector associated with a subset of
documents (to compute centroids for R and NR).
Again, your function should work with any query and any
specified sets of relevant and non-relevant documents. But, to
demonstrate your functions, use it to generate a new query Q1,
given the above query Q, documents sets R
and NR; and with alpha = 0.5 and
beta = 0.25. Provide your results displaying both Q and Q1
using the term dimensions in the original doc-term matrix.
- Next, using Cosine similarity, compute the ranked list of
returned documents for each of the queries Q and
Q1, using the full set of the document in the original
doc-term matrix. Explain the most significant promotion and the most
significant demotion in the relative rankings of the documents.
- Write a program/function to create a term-by-term association matrix
from a given document-term matrix that could be used for query expansion
based on Automatic Global Analysis (see
slide 7-12 of the lecture notes:
CSC575-501 -
Query Operations).
Note that an intermediate non-normalized term-term association matrix can be created by
multiplying the transpose of the document-term matrix (which is a
term-document matrix) by the document-term matrix, itself. This will result
in a symmetric term-term matrix where each entry corresponds to the dot
product of the corresponding terms. The final association matrix must be
computed by normalizing the entries using the Jaccard coefficient (slide 9).
Test your program on the document-term matrix from part a, above.
You should provide the full normalized term-by-term association matrix, S, as part if
your submission. For partial credit, you can also provide your
intermediate non-normalized term-by-term matrix (of dot products).
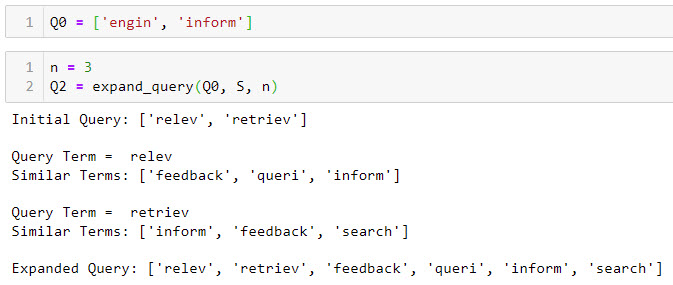
- Next, given the normalized term-term association matrix and a query
containing a subset of the terms in the matrix, write a program that outputs
an expanded query using global analysis with given value of n
(i.e., for each term T in the initial query, the top
n most similar terms to T should be added
to the expanded query, if not already present). Test your program using
the query: Q0 = ['relev', 'retriev'] with values of
n = 1 and n = 2. Your output,
submit with your assignment should clearly indicate related terms to be
added to the query Q0 corresponding to each term in the
original query. A sample output for a different test query is given in
this example.
- [50 pts] Content-Based Recommendation
In this problem, you will implement your own version of a rudimentary
content-based recommender system that will use the K-Nearest-Neighbor
(KNN) strategy to recommend items of interest to a user. A content-based
recommender can be viewed as a type of IR system that, instead of an explicit
user-specified query, uses a learned user profile to recommend similar items. As
in other IR systems, the items to be recommended as well as the user's profile
are represented as vectors over a set of features. Features may be textual
tokens (when items are documents), but they can also be other types of "content"
features that represent the characteristics of the items. For this assignment we
will use a preprocessed data set from Spotify where various songs are
represented in terms of different musical and acoustic features. We will assume
that, for each user, the system maintains a list of songs liked or played by the
user in the past (e.g., a playlist). A user's profile will be represented as the
aggregate vector representation of the songs in the user's playlist. The main
task for the system is to match the user's profile with representations of the
available songs and recommend the top k songs most similar to that profile. The
necessary data files are available in the archive:
Spotify_Preprocessed.zip. Be sure to
review the "readme" file which provides a more detailed description of each
file.
The basic tasks for this problem are the following:
-
Write
a function
knn(item, Data, K)
that given the vector representation of an item (in this case a
song), the Data matrix representing song features (from the
file: "Spotify_Numeric.csv"), and the number of
neighbors "K", will return the indices of the K
most similar songs to "item" in decreasing order of
similarity, along with the corresponding similarity values. Your
implementation should use cosine similarity function to find the K nearest-neighbors. You
can implement your own cosine function or use an external
library. Use the information contained in the file "Spotify_Metadata.csv"
to include information about the recommended songs in your
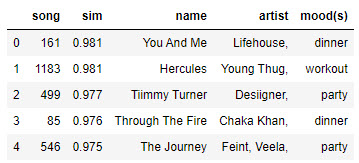
output (such song name, artist, song mood(s), etc.). For
example, given an item represented as the following feature
vector:
item = [0.1, 0.5, 0.2,
0.5, 0.0, 0.5, 0.0, 0.8, 1.0, 0.2, 0.5, 0.5, 0.3]
the knn function might produce an
output similar to this example.
Demonstrate your knn function by producing the top 10 most
similar songs the an item with the following feature vector:
item = [0.8, 0.1, 0.7, 0.0, 0.5,
0.1, 0.5, 0.2, 0.0, 1.0, 0.1, 0.2, 0.7]
-
Next, write a program/function to generate a list of
top K recommendations for a given user, given the user's
previously recorded playlist. The core of your "recommend"
function is a call to the knn function described above. However,
the recommend function should take as input not a single item,
but a user's playlist containing the indices of songs previously
played by the user (similar to user playlists in the file:
"Spotify_Users.txt"). The "recommend" function should generate
an aggregate representation of the lit of items by computing the
centroid (mean) vector corresponding to vector representations
of the songs in the user's playlist. This aggregate
representation is then used as input to the knn function to
generate the k most similar songs to the playlist as
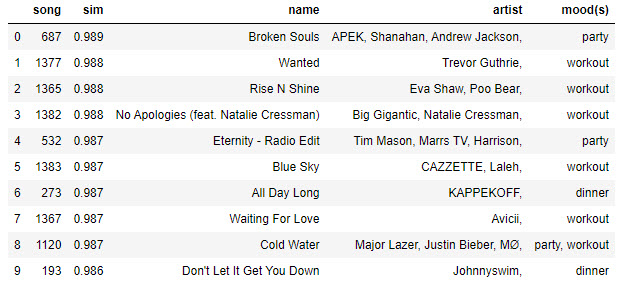
recommendations for the user. For example, given a user play
list:
playlist =
[1133, 1136, 1150, 1157, 1164, 1261, 1279, 1360]
and K = 10, the recommend function might generate an
output similar to this example.
To demonstrate your program, run your "recommend" function to
generate top 10 recommendations for the user 0 (first row
in the "Spotify_Users.txt") and for user 7 (8th row in
the same file).
-
Write a program/function to evaluate the
accuracy of your recommender system using Precision and Recall
metrics. We will use the user playlists in "Spotify_Users.txt"
as our test data. For each user, you should divide the playlist
in half with the first half to be used as the user profile for
input into the "recommend" function, and the 2nd half as the set
of relevant items for that user that are held out for testing
purposes (note that the list of songs in each playlist has
already been randomized). Ideally, we would like the recommend
function to generate as many of the held-out items as possible
for each user, but of course, the number of recommendations, K,
will be a factor. In this context, precision and recall may be
computed as follows.
Lets' denote the set of relevant
recommendations for a single user u as
Rel_u defined as the set of held out items (2nd
half of user's playlist). Let Rec_u denote the list of
top-k recommended items for user u
generated by the recommender with the first half of user's
profile as input. Precision@k for
user u is defined as |intersect(Rec_u,
Rel_u|)/|Rec_u|
which is the same as the number of common items between
recommendation list and the hold-out test set, divided by k.
Recall@k for user u is defined
as |intersect(Rec_u,
Rel_u|)/|Rel_u|,
i.e, the number of common items between the k recommended items and
the test set, divided by the size of the test set. To perform
evaluation of the system, average precision@k and recall@k
values (for a specific value of k) must be computed across all
test users (in this case the 20 playlists given in "Spotify_Users.txt"). This will produce avg_precision@k and
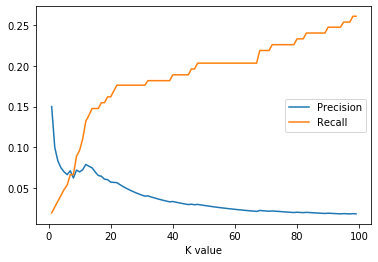
avg_recall@k. Finally, to tune the system,
avg_precision@k and avg_recall@k must be computed for a range of
values of k. You should write your own evaluation function
(rather than using existing libraries) and you should produce a
chart with avg precision and avg recall values relative to
values of k. You should use [1, 100] as your range of values of
k. This example
shows what your results might look like (though this is not the
expected result for the provided data set).
Back to Assignments
|
