Assignment 3
Due: Sunday, October 23
Due:
Thursday, October 27
For this assignment you will experiment with various regression approaches
and you'll get your feet wet with some clustering. We will rely on subsets of
some real-world data sets and on tools from the
Scikit-learn machine learning
package for Python as well as modules based on the textbook code (Machine Learning
in Action).
- Regression Analysis [Dataset:
communities.zip]
For this problem you will experiment with multiple linear regression models to
make predictions with numerical data. You will also explore more systematic
methods for feature selection and for optimizing model parameters (model
selection). The data set you will use is a subset
of the "Communities and Crime" data set that combines information from the
1990 census data as well as FBI crime data from 1995. Please read the
full description of the data,
including the description and statistics on different variables. The target
attribute for regression purposes is "ViolentCrimesPerPop".
Note: The two
identifier attributes "state" and "community name" should be excluded for
the regression task.
Your tasks in this problem are the following.
- [5 pts] Load and
preprocess the data using Pandas and remove the unneeded attributes. For the
purpose of this assignment you do not need to normalize
or standardize the data unless explicitly required in one of the following
tasks. However, you may need to handle missing values by
imputing those values based on variable means. Compute and display basic statistics
(mean, standard deviation, min, max, etc.) for the variables in the
data set. Separate the target attribute for regression. Use scikit-learn's
train_test_split function to
create
a 20%-80% randomized split of the data (important note: for
reporducible output across multiple runs, please use "random_state =
33"). Set aside the 20% test portion; the
80% training data partition will be used for cross-validation on various
tasks specified below.
- [10 pts] Perform standard
multiple linear regression on data using the scikit-learn Linear
Regression module. Compute the RMSE values on the full training data
(the 80% partition). Also, plot the correlation
between the predicted and actual values of the target attribute. Display the
obtained regression coefficients (weights) and plot them using matplotlib. Finally, perform 10-fold
cross-validation on the training partition and compare the cross-validation RMSE to the
training RMSE (for cross validation, you should use the KFold
module from sklearn.model_selection).
- [15
pts] Feature Selection: use
the scikit-learn to select the best subset of features to
perform linear regression. For feature selection, write a script or function
that takes as
input the training data; target variable; the regression model; and any other
parameters you find necessary. The function should return the optimal percentage of the
most informative features to use. Your approach should use k-fold
cross-validation on the training data (use k=5 for consistency) and use
feature_selection.SelectPercentile
to find the most informative variables for a range of percentile values [Note: since this is regression
not classification, in the
SelectPercentile
function you should use
feature_selection.f_regression as scoring function rather
than
chi2). You should also plot the model's error
values on cross-validation using only the selected features across the
range of percentile values. For variety, in this part we will use Mean
Absolute Error (MAE) as the error metric instead of RMSE. For
cross-validation, use scikit's
cross_val_score function. In order to use
cross_val_score with regression you'll need
to pass to it a specific error function. In this case, you will use
scoring='neg_mean_absolute_error' as a parameter. You should
use aboslute values to convert these negated MAE values to positive MAE
values.
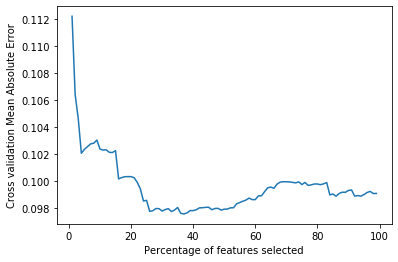
Your plot should look similar (but won't be exactly
the same as this example). Once
you have identified the best percentile based on cross-validation, use it to
identify and display the corresponding best features. As a final step, train
your model on the full 80% training data with the optimal subset of features
and then compute it's peformance (again using MAE) on the set-aside 20% test
partition.
[Note: For an example of a similar feature selection
process please review the
class example notebook
(though note that the task in this example was classification not
regression). Also, review
scikit-learn documentation for feature selection.]
- [10 pts] Next,
using the original train and test data in part (a), perform Ridge Regression and Lasso Regression using the modules from
sklearn.linear_model. In each case, perform systematic model
selection to identify the optimal alpha
hyperparameter (the regularization coefficient). You should create a function that takes as
input the training data and target variable; the parameter to vary and a list of its
values; the model to be trained; and any other relevant input needed to
determine the optimal value for the specified parameter. The model selection
process should perform k-fold cross validation (k should be a parameter,
but you can select k=5 for this problem). For each model, you should also plot the error
values (this time using RMSE as the error metric) on the training and
cross-validation splits across the specified values of
alpha. Finally,
using the best alpha
values for each regression model, train the model on the full training data and evaluate it on the set-aside test data.
Discuss your observations and conclusions, especially about the impact of
alpha on bias-variance trade-off. [Hint: for an
example of a similar model optimization process please review the
class example notebook.]
- [10
pts] Next, perform regression using
Stochastic Gradient Descent Regressor from scikit-learn (again use the
original train-test split in part (a).
Note that SGDRegessor requires that features be standardized (with 0 mean and scaled
by standard deviation). Prior to fiting the model, perform the scaling using
StandardScaler from
sklearn.preprocessing. For this problem, perform a grid search (using
GridSearchCV from
sklearn.grid_search). Your grid search should compare combinations of
two penalty parameters ('l2', 'l1') and different values of alpha (alpha
could vary from 0.0001 which is the default to relatively large values, say
10).
Using the best parameters, train the model on the full training partition
and apply the model to the set-aside test data, comparing traning and test
RMSE scores.
Finally, perform model optimization (similar to part d, above) to find the best
"l1_ratio" parameter using SGDRegressor with the "elasticnet" penalty
parameter. [Note: "l1_ratio" is The Elastic Net mixing
parameter, with 0 <= l1_ratio <= 1; l1_ratio=0 corresponds to L2
penalty, l1_ratio=1 to L1 penalty; defaults to 0.15.] Using the best mixing
ratio, apply the Elastic Net model, trained on full training data, to the set-aside test data and compare to
the training perfromance. Provide a
brief summary of your findings
from the above experiments.
- Automatic Document Clustering [Dataset:
newsgroups5.zip]
For this problem you will use a different subset of the 20 Newsgroup data set
that you used in Assignment 2 (see the
description of the full
dataset). The subset for this assignment includes 2,500 documents
(newsgroup posts), each belonging to one of 5 categories windows (0),
crypt (1), christian (2), hockey (3), forsale
(4). The documents are represented by 9328 terms (stems). The dictionary
(vocabulary) for the data set is given in the file "terms.txt" and the full
term-by-document matrix is given in "matrix.txt" (comma separated values).
The actual category labels for the documents are provided in the file "classes.txt".
Your goal in this assignment is to perform clustering on the documents and
compare the clusters to the actual categories.
Your tasks in this problem are the following [Note: for the
clustering part of this assignment you should use the
kMeans module form Ch. 10 of MLA (use the
version provided here as it includes some corrections to the book version).
Do not use the KMeans clustering function in scikit-learn. You may use Pandas and other modules from scikit-learn that you may
need for preprocessing or evaluation.]
- [5 pts] Create your own distance function that, instead
of using Euclidean distance, uses Cosine similarity. This is the distance
function you will use to pass to the kMeans function in the included module.
Note: you should not use external function for computing Cosine. Write your
own version that computes Cosine similarity between two n-dimentional
vectors and returns the inverse as the distance between these vectors.
- [10 pts] Load the data set [Note: the data matrix provided
has terms as rows and documents as columns. Since you will be clustering
documents, you'll need to take the transpose of this matrix so that your
main data matrix is a document x term matrix. In Numpy, you may use the ".T"
operation to obtain the transpose.] Then, use the train_test_split function
(with random_state = 99) to perform a randomized split the data set (the document
by term matrix) and set aside 20% for later use (see
below). Use the 80% segment for clustering in the next part. Next, as in the previous assignment, perform TFxIDF
transformation on these data sets. [Note: if you have
difficulty with TFxIDF conversion, then use the original non-transformed
data for the remainder of this assignment].
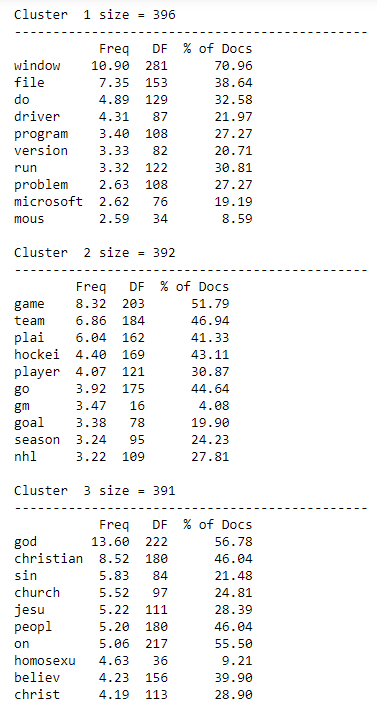
- [20 pts]
Perform Kmeans clustering on the transformed training data
from part (b) Perform a
qualitative analysis of the clusters by examining top features in each
cluster and identifying patterns in the data. To facilitate your analysis of
the clusters, write a function
to display the top N terms in each cluster sorted by decreasing centroid weights for each term in the
cluster (mean TFxIDF frequency of the term). Your output should also display
the cluster DF value for the top N terms. The cluster DF value for a term
t in a cluster C is the percentage of docs in cluster
C in which term t appears (so, if a
cluster has 500 documents, and term "game" appears in 100 of those 500
documents, then DF value of "game" in that cluster is 0.2 or 20%). For each
cluster, you should also display the cluster size (the nunber of documents
in the cluster). Here is an example of how this
output might look like (here the top 10 terms for a sample of clusters
are displayed in decreasing order of mean TFxIDF weights from the cluster
centroids (the "Freq" column), but in addition the cluster DF values (both
raw and as a percentage) are also shown).
Important Note: for this problem you should try several values of k
for the number of clusters (try values of k from 4 through 8) and in each
case try several runs in order to obtain clusters that seem more meaningful.
In some cases, you may find some small clusters containing noise documents,
which is not unusual. The point is to experiment with different runs and
cluster numbers until you find at least several clusters that seem to
capture some of the key topics in the documents. You do not need to provide
the results of all your runs; you should only provide the results of your
best clustering along with a brief discussion of your experimentation and
your final observations.
[Extra Credit - 5 pts: use your favorite third party tool
or library, ideally with a Python based API, to create a word cloud for each cluster
(using your best clustering from earlier experiments.]
- [5 pts] Using the cluster
assignments from your Kmeans clustering and the original cluster labels for
the training document,
compare your clusters to the re-assigned classes by computing the
Completeness and Homogeneity values. You should do this for the
best values of k and the best clustering run you settled on in the previous
part.
[Extra Credit - 5 pts: Try several
other clustering runs each time with values of k ranging between 4 and 8 and in each case
compute Completeness and Homogeneity. This experiment will indicate which
clustering provides the best representation of the original newsgroup
categories. Provide a brief report of your experiment including a comparison
of final results for at least three different runs.]
- [10 pts] Finally, using your cluster assignments as class labels,
categorize each of the documents in the 20% set-aside data into each of the
appropriate clusters (using your final clustering results in part c). Your categorization should be based on Cosine
similarity between each test document and cluster centroids. For each test
document show the assigned cluster label as well as Cosine similarity to the
corresponding cluster.
Notes on Submission: You must submit your Jupyter Notebook
(similar to examples in class) which includes your documented code, results of
your interactions, and any discussions or explanations of the results. Please
organize your notebook and label sections so that it's clear what parts of the notebook correspond
to which problems in the assignment (submissions that are not
well-organized, not well-documented, or are difficult to read will be penalized). Please submit the notebook in both IPYNB
and HTML formats (along with any auxiliary files). Do not compress or
Zip your submission files; each file should be submitted independently. Your assignment should be submitted
via D2L. |
