LSP 120 Midterm Practice
WARNING: It would be unwise to use this practice as the only studying you do for the midterm. There will additional material on the midterm that is not represented here. Make sure you look over all of the activities and homework.
Percentages
1. Items at a store were marked down 20%. The store then advertises that they will take an additional 20% off at the register when you make your purchase. By how many percent are prices reduced under this sale?
The price first dropped from 100% to 80%. Then it drops by 20% of 80% or 0.2*0.8=0.16, i.e., 16%. So in the end, it is 20% off for the first reduction, then an additional 16% off, for a total of 36% off.
2. Chlorofluorocarbons (CFC's) are chemicals that harm the ozone layer that protects the earth from ultraviolet radiation from the sun; they also cause global warming. CFC's were used in refrigerators (freon is a CFC) and in the making of other chemicals. In 1950, world CFC production was 42 thousand tons. In 1988 their production peaked at 1260 thousand tons. The most recent figures available (1996) put production at 141 thousand tons.
a. By how many percent did production increase from 1950 to 1988?
Production increased by 2900%. The calculation is (1260-42)/42=29.
b. By what factor (how many times more) was the 1996 production larger than the production in 1950?
Production in 1996 was larger than the production in 1950 by a factor of 3.4. The calculation is 141/42.
c. By how many percent was 1996 production less than the production in 1988?
Production in 1996 was 89% less than in 1988. The calculation is (1260-141)/1260.
d. From 1949 to 1950, production grew by 12%. How many tons were produced in 1949?
Production in 1949 was 37.5. The calculation is x(1+.12) = 42. x=42/1.12 x=37.5
Sorting Data using Excel
3. Open the file mileage.xls which contains the city and highway mileage for 1996 model cars and four-wheel drive vehicles. Using Excel's sort function, determine:
a. Top three mid-size cars which get the best city mileage: Mazda 626, Buick Century, Dodge Stratus
b. The mid-size car model that gets the best city mileage: Dodge Stratus
c. The mid-size car model that gets the worst highway mileage: Jaguar XJ12
d. The four wheel drive car model that gets the best city mileage: GeoTracker
Linear Modeling and Trendlines
4. Open LeaningTowerOfPisa.xls file. Make a linear model of this data (an X,Y scatter graph of the data with a trendline with equation and R-squared value).
a) What does the R-squared value tell you about the data.
b) Use the equation to make a prediction for the size of the lean in 2002. How much confidence do you have in the prediction? What factors affect your confidence?
c) In what year was the size of the lean 0 meters? How much confidence do you have in the prediction?
a. The R-squared value is 0.988. Since this is very close to one, the data is very close to linear.
b. To make a prediction of the lean in 2002, plug 2002 in for the x in the trendline equation. 0.0009*2002 + 1.1233 = 2.9251. With this high R-squared value, if we were making a prediction for 1988 or 1989, I would have high confidence. 2002 is 15 years after the last given data year, however, far enough away to decrease my confidence.
c. To find the year for which the lean was 0 meters. Plug 0 into the equation for y and solve for x.
0 = 0.00009x + 1.1233
- 1.1233 = 0.0009x
-1.1233/0.0009 = x
-1248 = x
Since x represents years, the prediction is that in the year 1248BC, there was no lean in the tower. I have no confidence in that prediction because construction of the tower began in 1173. So even though the data we have is very linear, there is no guarantee that is will continue to be or was always linear.
Exponential Modeling
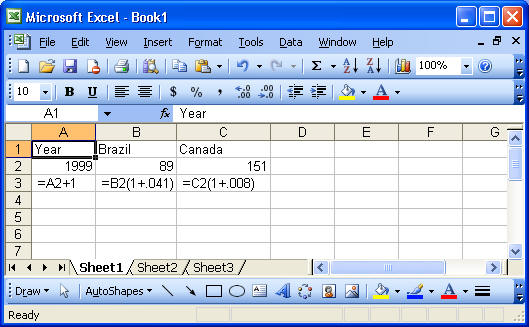
5. Carbon dioxide emissions from the burning of fossil fuels are almost surely a cause of global warming. One of the difficulties in negotiating a treaty for the reduction of carbon dioxide emissions is the discrepancy in emission levels between developing and developed nations. For example, in 1999, Brazil emitted 89 million metric tons of carbon into the atmosphere, while Canada, a much less populous country, emitted 151 million metric tons. Brazil’s emissions, however, are growing at 4.1% per year, while Canada’s are growing at 0.8%.
Answer:
Extending the model, in a., Brazil’s emissions will exceed Canada’s in 2016.
I have only moderate confidence. 17 years is quite far from the existing data. I am not sure that Brazil will be able to keep up a 4.1% annual rate of percentage increase for so long. On the other hand, I have complete confidence that Brazil’s emissions will exceed Canada’s in the not so distant future.
f(x) = 89 * (1.041) ^ x or written more traditionally f(x) = 89(1.041)x.
2010 is 11 years after 1999. f(11) = 89 * (1.041) ^ 11 » 138.5 metric tons.
f. Using logarithms, calculate when Brazil’s output will equal 150 metric tons.
150 = 89 * (1.041)^x
1.69 = (1.041)^x
log(1.69) = x * log(1.041)
0.228 = x * 0.017
x = 13.4
1999 + 13.4 = 2012.4
6. In 1994, 24 samples from the archeological site at Oslonki, Poland were dated using carbon 14. The archeological site is significant for the large quantities of copper implements and jewelry found there.
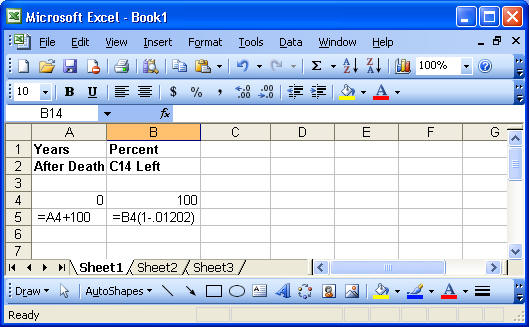
a. One of the samples had 47.8% of the carbon 14 that would normally be present in a living organism. Approximately, how old is the sample? (Carbon 14 decays approximately 1.202% every 100 years.) Please include the Excel table you used to calculate your answer; if you didn't use an Excel table to calculate your answer, briefly describe your calculation.
The Excel table is long, so I'll only paste in the beginning. The sample is about 6100 years old.
b. How old was the sample when 66.3% of the carbon 14 was left?
66.3 = 100 (1-0.01202) ^ x
0.663 = (0.98798) ^ x
log(0.663) = x * log(0.98798)
-0.1785 = x * -0.00525
x = 34
100 * 34 =~ 3400 years
Absolute vs. Relative
7. Open the file CrimeRatesByState.xls. Does the column Population contain absolute or relative values? Does the column Reported Crimes contain absolute or relative values? If the Reported Crimes values are absolute, how would you make them relative values using only the data in this spreadsheet?
The column Population contains absolute values, as does the Reported Crimes column. To make the Reported Crimes values relative, divide each Reported Crimes value by the corresponding Population value. You then have Reported Crimes based on the population, or Reported Crimes per capita.