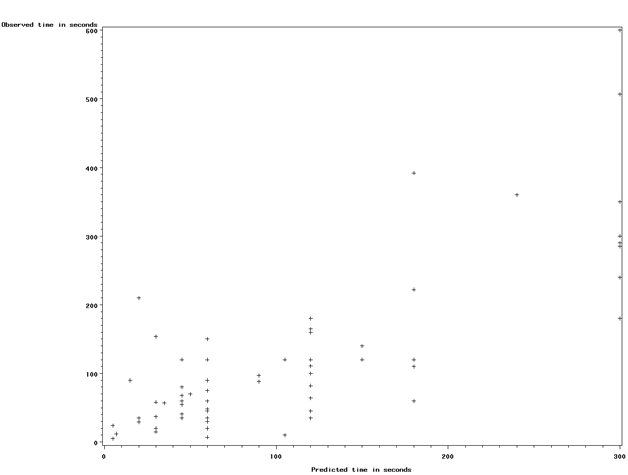
This scatter plot shows how the predicted times compared to the observed times.
The correlation is .79. The estimated regression equation is approximately
observed = 1.06 * predicted + 7.7